Product preview · interactive

From a typed question to a board-ready verdict.

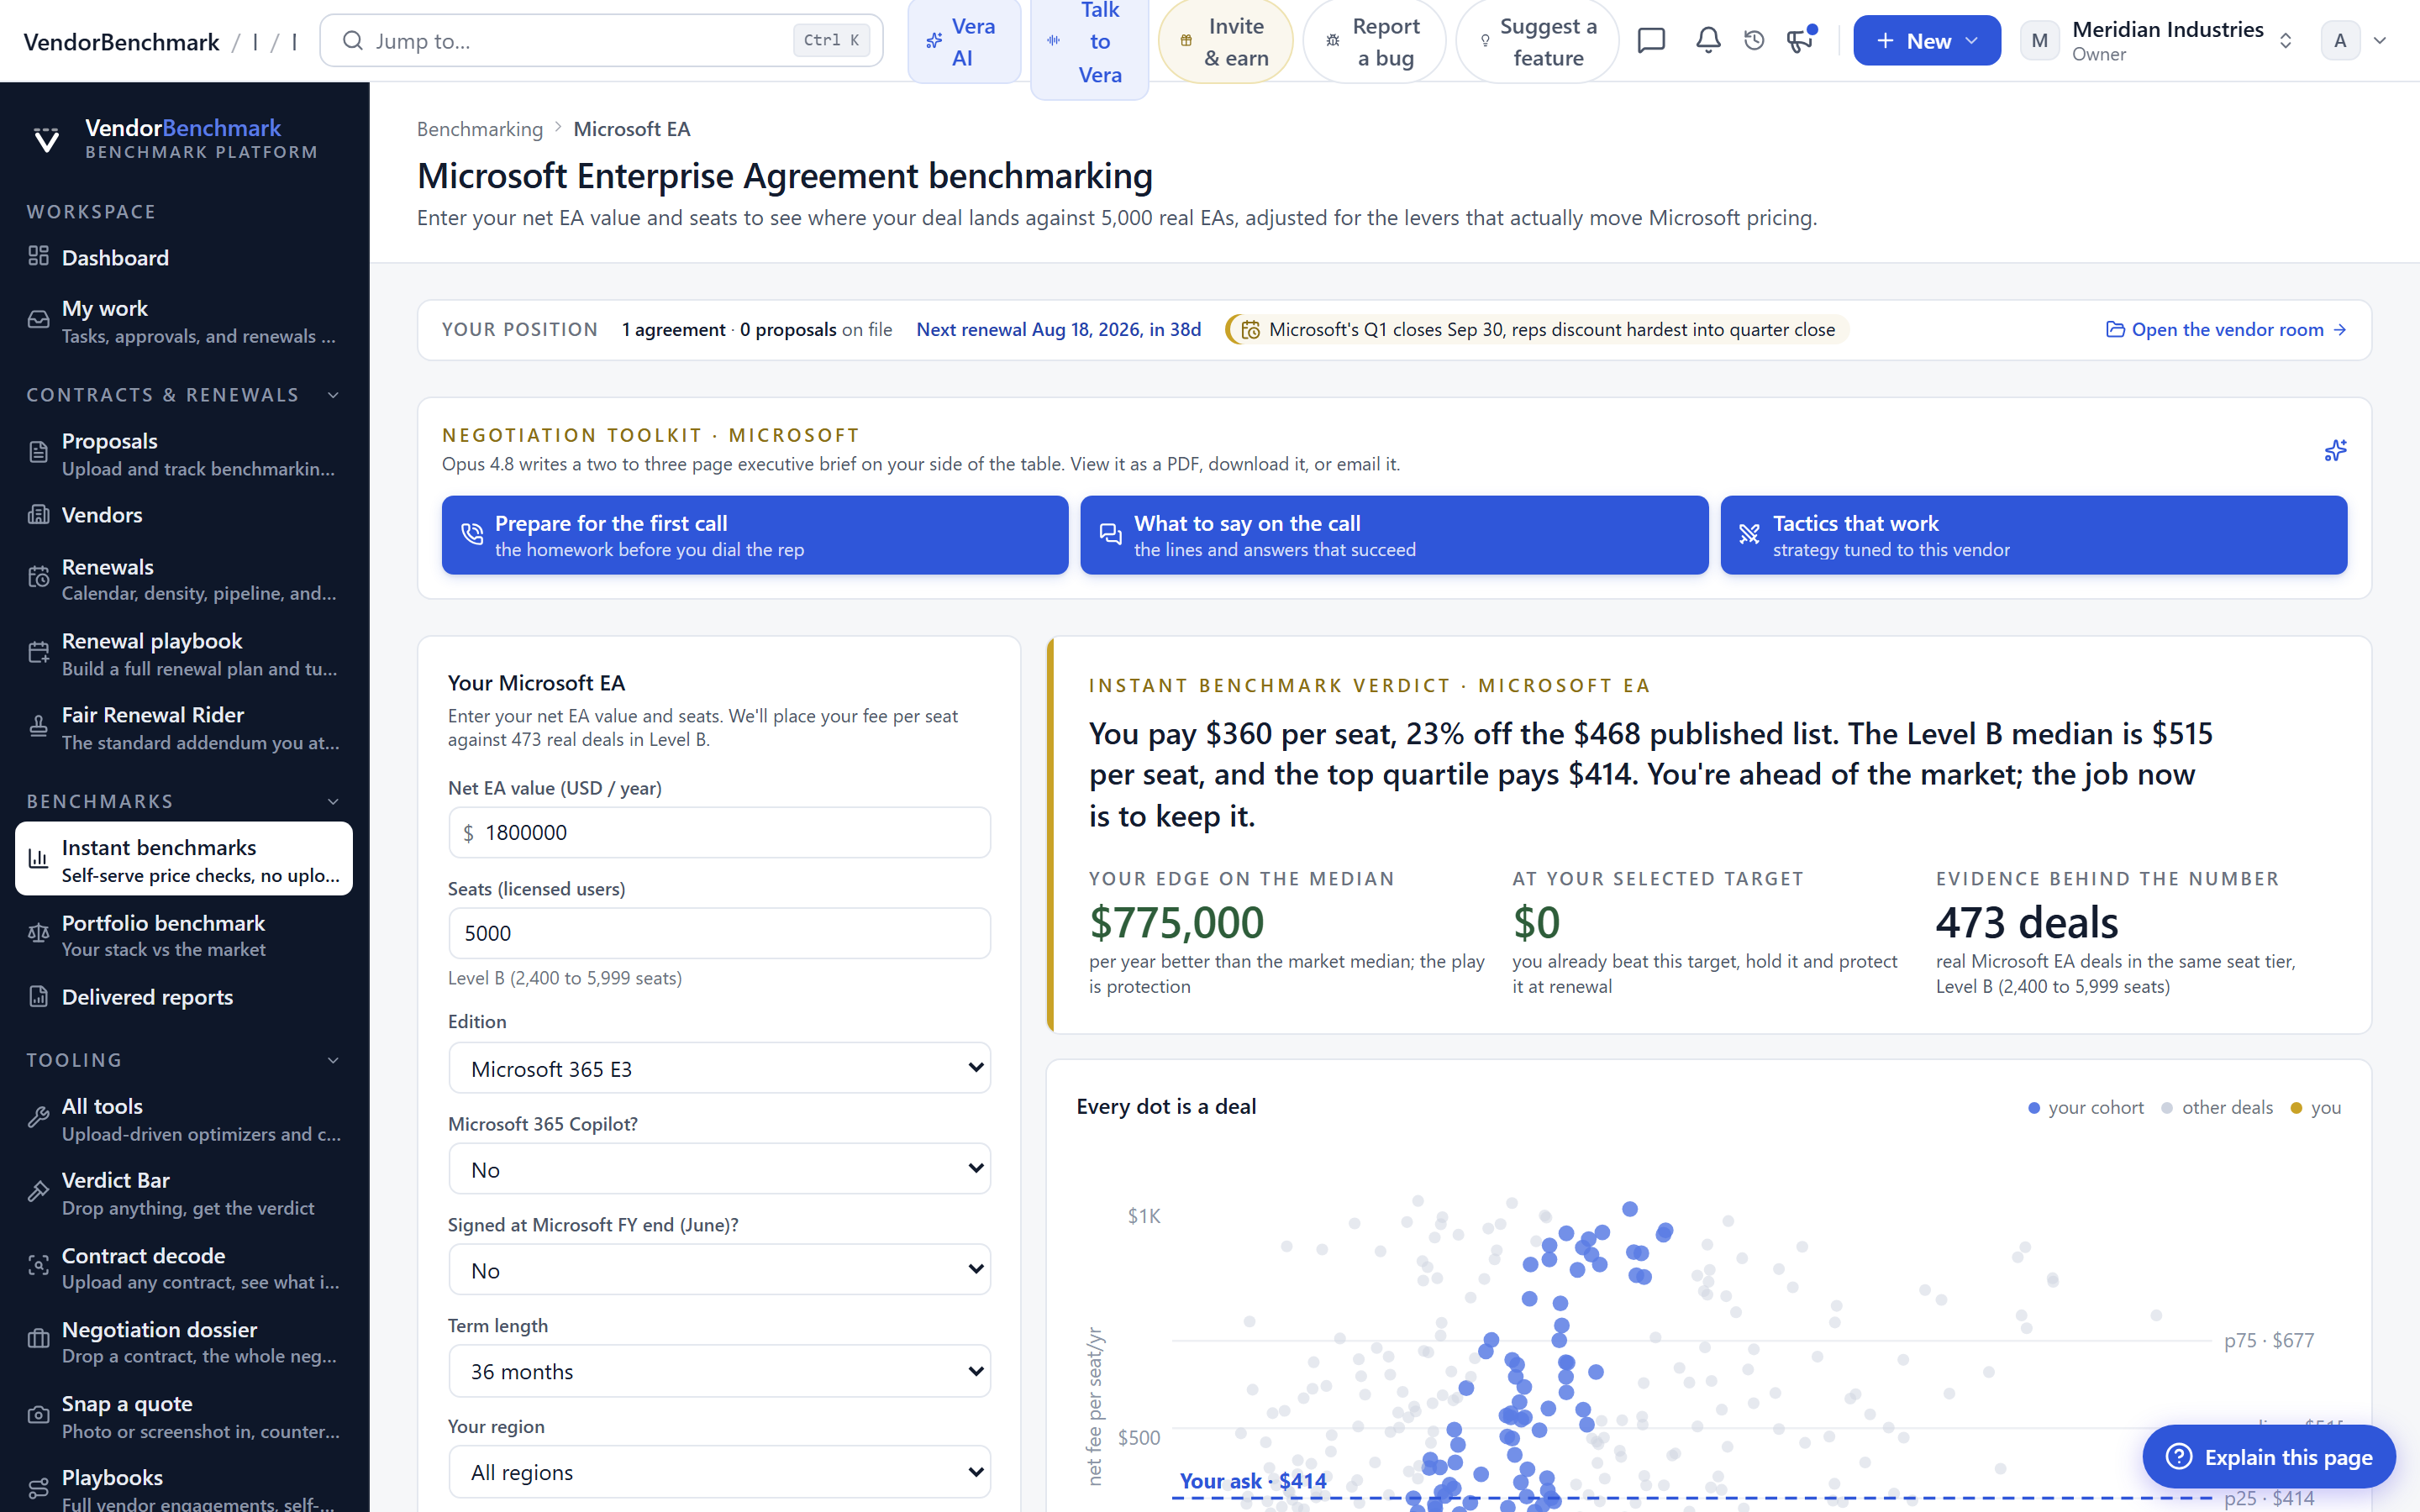
This is the instant benchmark exactly as it works inside the platform: search 610 benchmarks, get the verdict, the evidence, and the play. Try it below, the layout is fully live.

The blurred figures are illustrative placeholders, not market data. Real numbers are computed for your deal, against real anonymized agreements, inside the platform.

app.vendorbenchmark.com / benchmarking
Instant benchmark

Ask the market.

Every answer is grounded in real, anonymized closed transactions. Type a vendor, or ask the question the way you would ask an analyst.

↑↓ moveTab complete runEsc clearlocal index · 456 vendors · <16ms
Live · 610 benchmarks · 456 vendors · 500,000+ closed transactions · refreshed continuously
app.vendorbenchmark.com / benchmarking / workday-hcm
Benchmark verdict · Workday HCM · assembling against comparable agreements…
Unlock with your data
Your deal Net $1.95M/yr3,000 employees List $2.27M3 year term N. EuropeManufacturing Annual prepay Placed against comparable deals in your size band. Small cohorts are flagged and rankings turn indicative.

What this is: the scope every number on this page is computed from, your price, size, term, region, industry, and deal structure. Why it matters: a benchmark without a scope is a horoscope; change any field and the whole verdict recomputes live.

01
The verdict
what your Workday deal is worth
Benchmark Verdict · Workday HCM Scope: 3,000 employees · 3 year term · Northern Europe

You are paying 14% above the market median for this scope.

Savings at stake
$723K
Your $54.20 per employee per month against the $47.50 cohort median, at 3,000 employees over the 3 year term.
Cohort size, size band, data recency, and methodology version are disclosed right here, next to the number, in the real product.
Where your price lands $ per employee per month
You · $54.2071st percentile
$38.00 low
$47.50 median
$68.00 high

What this is: the market range for your scope, lowest to highest price paid, with the middle 50% shaded and the median ticked. How to read it: your dot right of the median means you pay more than most; the distance to the tick is the money on the table.

The cohort, deal by dealanonymized deals · your scopeUnlock

What this is: every comparable deal as an anonymized dot, priced per employee per month; the gold dot is you. How to read it: every dot left of yours pays less at your scale. That crowd is your negotiation, not our opinion.

Percentileyour rank on price in the cohort
71st
Your discount off listversus what your band negotiates
14%
Renewal upliftwhat happens to the price at each anniversary
Uncapped

What these are: the three levers behind the headline. Percentile is your rank on price. Discount off list is what you negotiated versus what your band negotiates. Renewal uplift is what happens at each anniversary, uncapped means the vendor decides.

See your real number, free In the platform: prepared by Vera, grounded in stored reference data, every figure cited
02
The evidence
the cohort behind the number
Provenancewhere the data comes from
2022–2026signing years
14industries
4regions
214deals in cohort
monthlydata refresh
k ≥ 5anonymity floor

What this is: the pedigree of the dataset behind every figure. Every benchmark draws on 200+ comparable transactions minimum. Why it matters: a benchmark with no cohort is a vendor whisper; if a dataset runs stale, the page says so and downgrades its own confidence.

Your gap, five wayscohort slicesUnlock
Compared againstMedian PEPMYour gapn
Your size band · 2,000 to 5,000 employees$47.50+14%31
Your industry · Manufacturing$46.80+16%26
Your region · Northern Europe$48.10+13%38
Best in class · top decile of your band$41.20+32%9
Nearest 15 deals · closest size, term, region$47.90+13%15

What this is: the same comparison cut five different ways, so no single slice can flatter or condemn you. How to read it: when every slice agrees, the case is robust; if the slices disagreed, the honest read would be "mixed" and the page would say so.

Price for your size
$60 $50 $40 market median You 250 1,000 3,000 10,000 20,000

Median price per employee per month by deal size, log scale · shaded band is the 25th to 75th percentile · your dot sits above the band for your size, which is the whole negotiation in one picture.

Every deal, price against sizeExpanded

What this is: the raw scatter behind the curve, every deal plotted by size and price, your deal in gold, your selected ask circled in blue. How to read it: the dots at your deal size below your marker are the negotiation: same scale, lower unit price. In the platform, hovering any dot shows its terms.

What a strong deal looks like
Under 1,000 employees
12 to 18% off list
1,000 to 2,000
18 to 22%
2,000 to 5,000 · your band
22 to 30% · you: 14%
Over 5,000
28 to 35%

What this is: what buyers your size actually negotiate off list price, by deal size. How to read it: discounts deepen with scale; when your discount sits below your band's floor, the list-discount conversation alone recovers most of the gap.

Median price by regionyours highlighted
N. Europe · you$48.10
N. America$46.20
DACH$49.00
APAC$50.30

Why it matters: region moves the median. You are ranked against your own region first, so a cheap deal in another market never flatters yours.

Price trend by signing yearmedian at signature
2022$50.80
2023$49.60
2024$48.40
2025$47.80
2026$47.50

How to read it: new signatures keep getting cheaper. A deal signed years ago and never repriced quietly drifts above market, which is exactly what this view catches.

Played forwardwhat waiting costsUnlock

At your price the next 3 years cost $5.85M. At the band median they cost $5.13M. The gap, $723K, compounds silently at every uncapped uplift, which is why the uplift cap is ask number one.

What this is: your deal and the market median played forward over the term, in cash. Why it matters: this is the number your CFO asks about; it turns a per-unit gap into a budget line.

03
The play
the ask, the timing, the counters
Pick your targetevery number recomputes liveUnlock
Open with$45.50anchor below target, backed by the band
Settle at$46.90your selected target
Walk away$51.00above this, take the 1 year bridge instead

What this is: three negotiation targets ranked by ambition, each priced from the cohort, plus the ladder to run them. How to read it: pick one and the savings figures, the sticky strip, and the exported brief all follow it.

Scenario theatreExpandedcounter-configure the deal, the totals reflow
Employees3,000
Term3 years
Price scenario$46.90 PEPM
$5.06MTotal cost of scenario
$5.85MAt your current price
$0.79M savedThe difference

What this is: the counter-configuration bench: seats, term, and price as rails you drag before the call, the cohort math reflows live. Why it matters: when the rep counters with "what if you grew to 5,000 seats," you already know that answer to the dollar.

Should-cost, built upwhy the target is defensible
Vendor list price$63.00
Volume tier−$6.30
Multi-year commit−$4.20
Competitive tension−$3.10
Payment structure−$1.90
Should-cost$47.50
You pay today$54.20

What this is: the market price rebuilt from list, subtracting what each lever is worth in your cohort. Why it matters: a target with a build-up survives procurement review; a target pulled from the air does not.

The strike windowwhen to ask
Today 
Send the ask8 weeks out
Renewalyour date
Vendor Q closetheir date

What this is: your renewal date against the vendor's fiscal calendar. How to read it: when your renewal lands near their quarter close, that is near-maximum pressure; open early enough that the ask is sitting in their commit sheet when the quarter squeezes.

Your leveragecheck what is true, the score follows

Leverage 3 of 8 · the strong target is in reach; add a move or two before asking for stretch.

What this is: the facts that decide which target you can actually land, scored. How to read it: under 3, take defensible. 3 to 5, strong. 6 plus, stretch is a fair ask.

Terms that move money
ClauseYour positionBand normVerdict
Renewal uplift capUncappedCPI or 3%, whichever is lowerRisk · quantified in the platform
Non-renewal notice180 days90 daysRisk · halves your leverage window
Price hold on expansionAbsent12 month hold at contracted rateCaution
Payment termsAnnual prepay, net 30Quarterly available at your sizeCaution
True-up cadenceAnnual, at contracted rateAnnualFavorable

What this is: the contract terms that move real money, your wording against what your band normally secures, with the dollar exposure where it is quantifiable. How to read it: brick means fix it this cycle, dark gold means push if there is room, green means keep and do not trade it away.

The negotiation case
Target price
$46.90
the size-adjusted median, with the build-up to defend it
Walk-away
$51.00
above this, the multi-year commit is not worth signing
Full case value
$885K
reprice to target plus the uplift exposure removed
Ask sequence
  1. Cap the uplift first. It costs the vendor little this quarter and removes your largest tail risk; most of your band secured a cap.
  2. Then reprice to the band. Anchor below target, settle at the size-adjusted median; it is the defensible line.
  3. Trade term for rate. Offer the multi-year commit only in exchange for band-floor pricing and the expansion price hold.

What this is: the order of asks, sequenced so the cheap-for-them concession comes first and the big one lands at their quarter close.

When they push backExpandedthe counters, pre-loaded
"That price doesn't exist at your size."It is the median of the deals your size closed recently. Happy to walk through the distribution.
"The uplift is standard policy."Most comparable agreements cap it. We are asking for the standard, not an exception.
"We can only move at a bigger commit."The multi-year commit is on the table, priced: it is worth band-floor pricing and the expansion hold, per your own market.
"Sign by Friday and we will look at it."Our renewal date and your quarter close are both on the calendar. We are comfortable letting both dates do their work.

What this is: the objections that show up in nearly every renewal, each answered with a figure from this page. Why it matters: a number survives first contact only if the person carrying it can defend it in the room.

In the platform, every figure on this page carries a citation to the cohort behind it: deal count, size band, geography weighting, recency window, and methodology version. Distributions are k-anonymous. This preview shows the layout only; all figures above are illustrative placeholders.

What you just saw
Real deals, not survey averages

Inside the platform, every figure comes from real, anonymized closed agreements, matched to your size band, region, and industry, with the cohort disclosed next to the number.

A verdict, not a chart dump

The answer leads: the dollar delta, then the evidence, then the play, targets, timing, leverage, and counters, structured so it can go straight to a CFO.

Honest by construction

Small cohorts are flagged, out-of-range deals are refused rather than extrapolated, and stale datasets downgrade their own confidence. The caveats survive into every export.

Ready to see your real number?
Run this exact verdict against your own deal, with every figure computed and cited. Free to start.
Get started free
More free tools
Decode a contract free Workday price check Software Price Index ROI calculator