Survey benchmarks flatter everyone. Researched pricing evidence does not.
Most software pricing benchmarks are surveys: someone remembers a discount, rounds it up, and a year later you negotiate against the average of those memories. Here is why that fails, what a defensible benchmark actually requires, and how modelled deal cohorts change the answer you walk in with.
Ask ten procurement leaders what discount they got on their last big renewal and you will get ten confident answers. Check those answers against the signed order forms and a pattern appears: people remember the discount off list, not the net price; they remember the headline number, not the metric change that took half of it back; and nobody remembers the deal that went badly. Survey based benchmarks are built from exactly these memories.
That would be a harmless academic problem if benchmarks stayed in slide decks. They do not. A benchmark is a number you repeat to a vendor with your credibility attached. When it is wrong, it is wrong in the worst possible way: it anchors you low, the vendor agrees to it quickly, and everyone leaves the table feeling good about a bad deal.
Four ways survey data fails you at the table
It is self reported. Respondents overstate wins, understate concessions, and skip the deals they are not proud of. The bias is not random, it is systematically flattering, which means the "market average" you read is better than the market anyone actually experienced.
It measures the wrong number. Discount off list is the vendor's favorite statistic, because the vendor controls the list. A 60 percent discount off an inflated list can be a worse deal than 20 percent off an honest one. The only number that survives scrutiny is the net unit price: net value per seat, per core, per functional user, per committed dollar.
It is stale. Enterprise pricing moved more in the last three years than in the previous ten. AI add-ons appeared on every order form, a major virtualization vendor repriced its entire base, and list increases landed across the industry. A survey fielded eighteen months ago describes a market that no longer exists.
It cannot be normalized. A 500 seat deal in retail and a 50,000 seat deal in banking do not belong in the same average. Without deal size, term length, region, edition, and timing, an average is just noise with a decimal point.
What a defensible benchmark actually requires
The alternative to memory is evidence: benchmarks built from modelled deal cohorts, the researched numbers, not the remembered ones. VendorBenchmark's library covers 1,471 vendors on a base of modelled deal cohorts, and every benchmark follows the same method. The metric is the net unit price that matters for that vendor. The cohort is deals comparable to yours on size, term, region, and edition. The output is a percentile, not an average, because you need to know where you stand in the distribution, not what the middle of a noisy pile looks like.
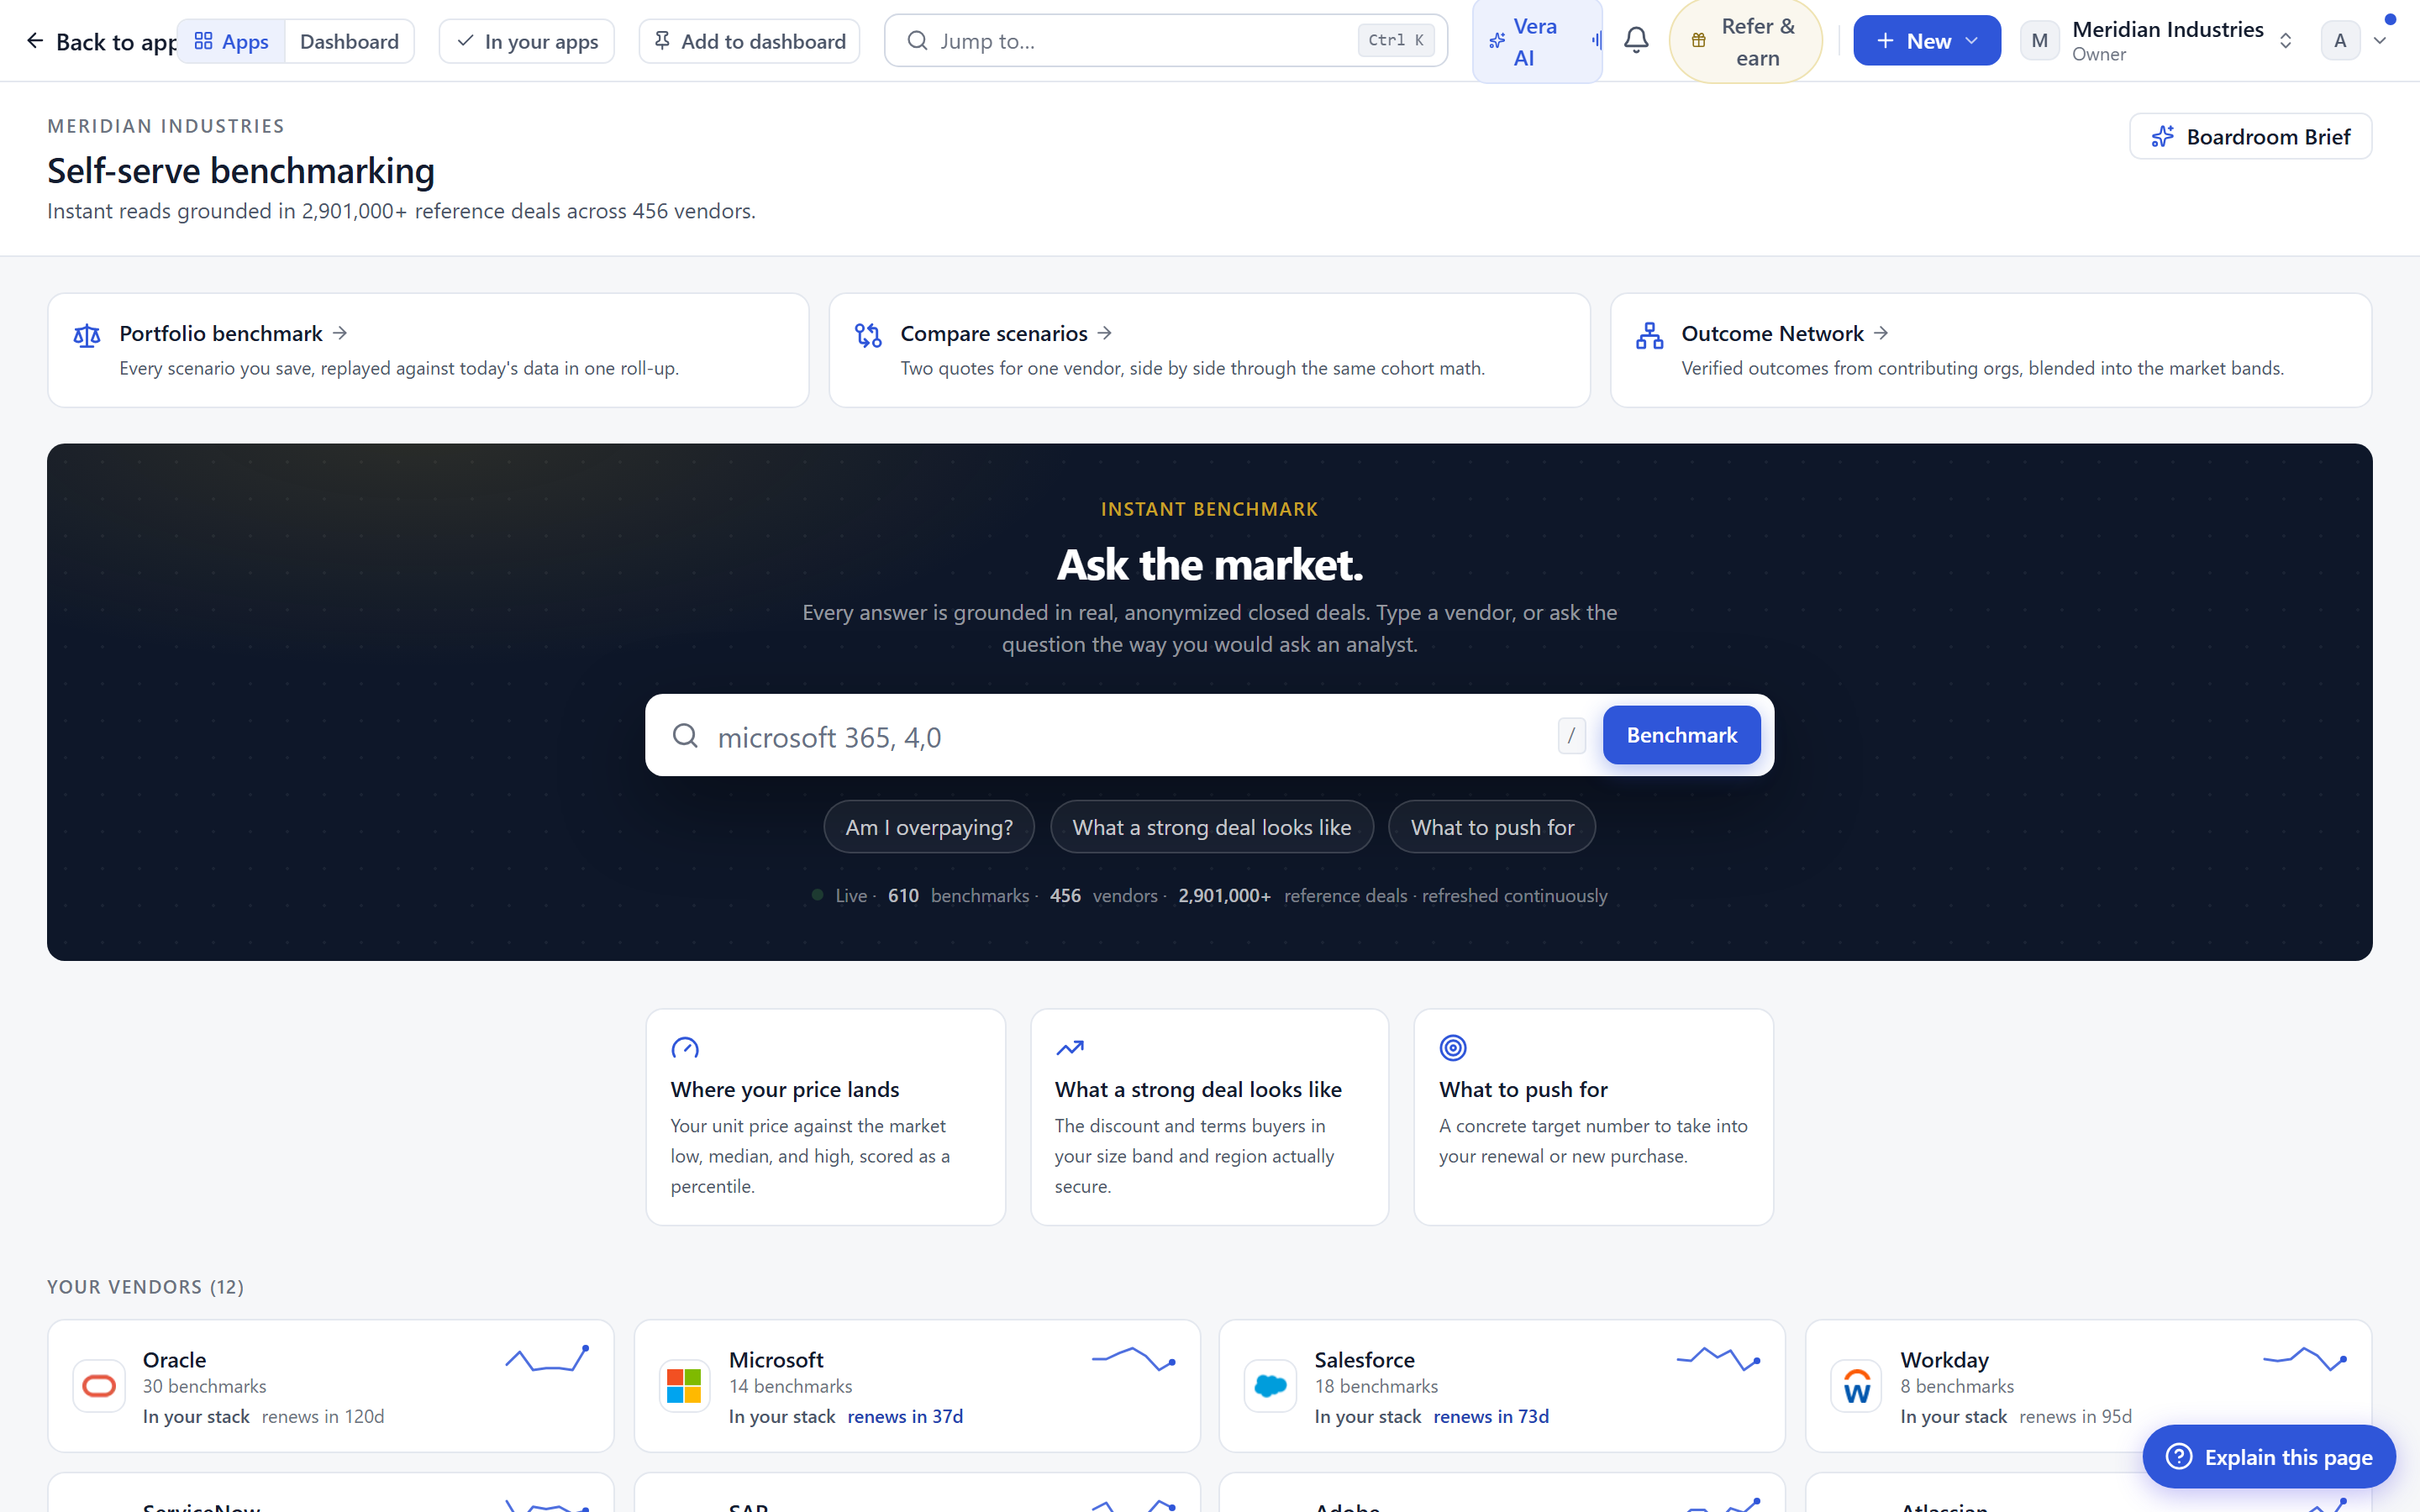
Running one takes minutes, not a procurement project. Enter your net price and deal size, and the engine places you against the comparable cohort. For flagship vendors like Microsoft EA, Salesforce, or Workday, that cohort runs deepest. The result is specific enough to act on: your percentile, the market low, median, and high for deals shaped like yours, and what moving to the median or the top quartile is worth in dollars.
How the data stays honest
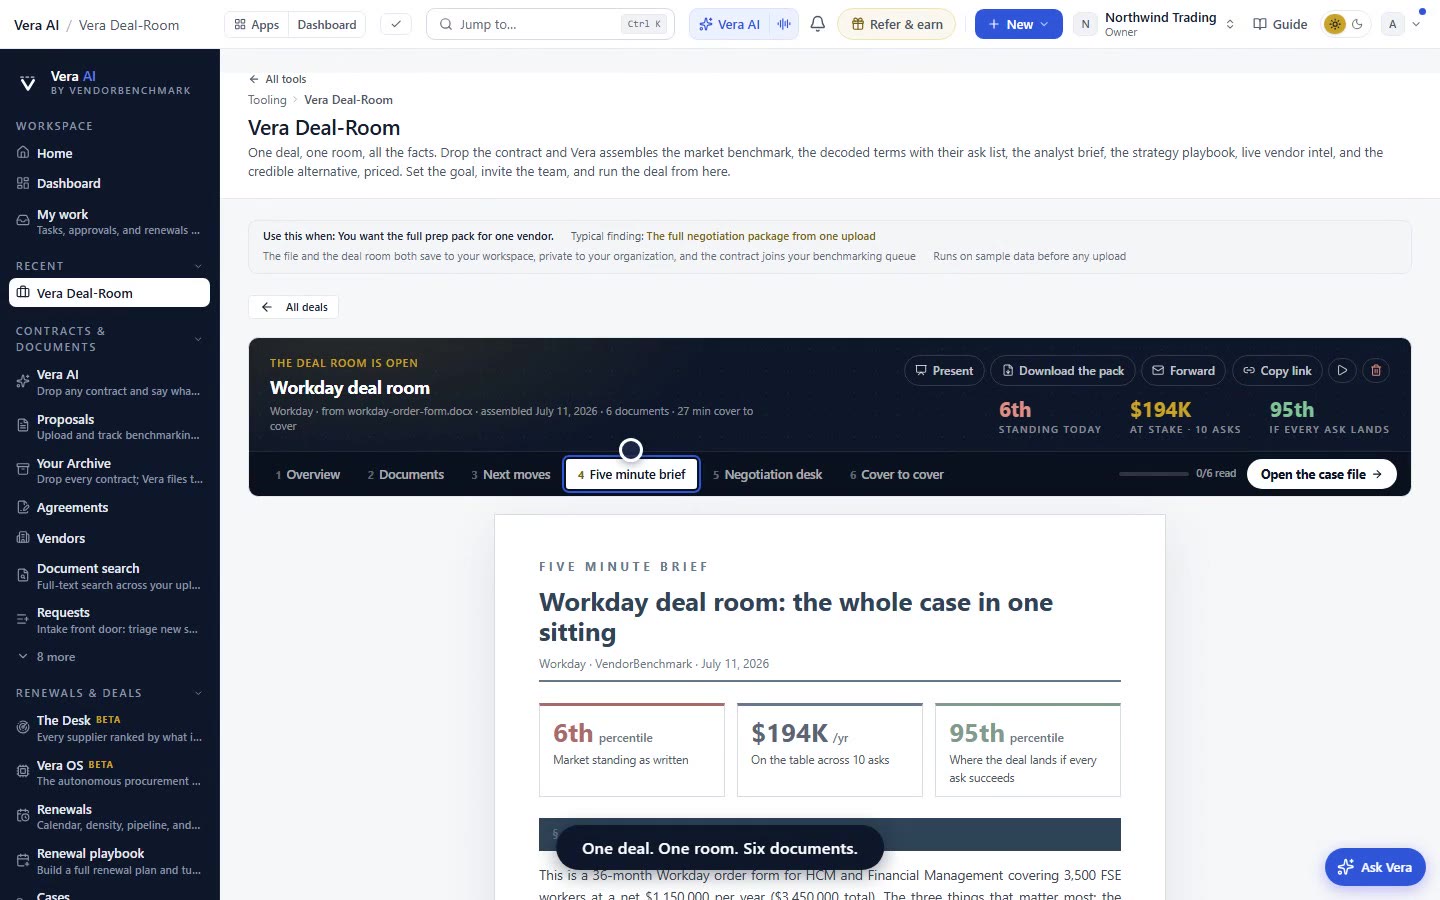
Pricing evidence has its own failure mode: it decays. So the library is maintained the way an index should be. Contributed datapoints are graded by analysts before they can influence a percentile. Cohorts are recency weighted, and benchmarks are recalibrated as the market moves rather than on an annual ritual. The Outcome Network adds a verified layer on top: contribute one anonymized outcome and unlock the realized uplift peers actually paid, aggregated with a strict five peer minimum so no single deal is ever identifiable.
And because a benchmark you cannot cite is a benchmark you cannot use in a board paper, the quarterly Software Price Index publishes a dated, citable record of where enterprise pricing moved. When you push back on a quote, you point to an index with a date on it, not an anecdote.
From one deal to the whole estate
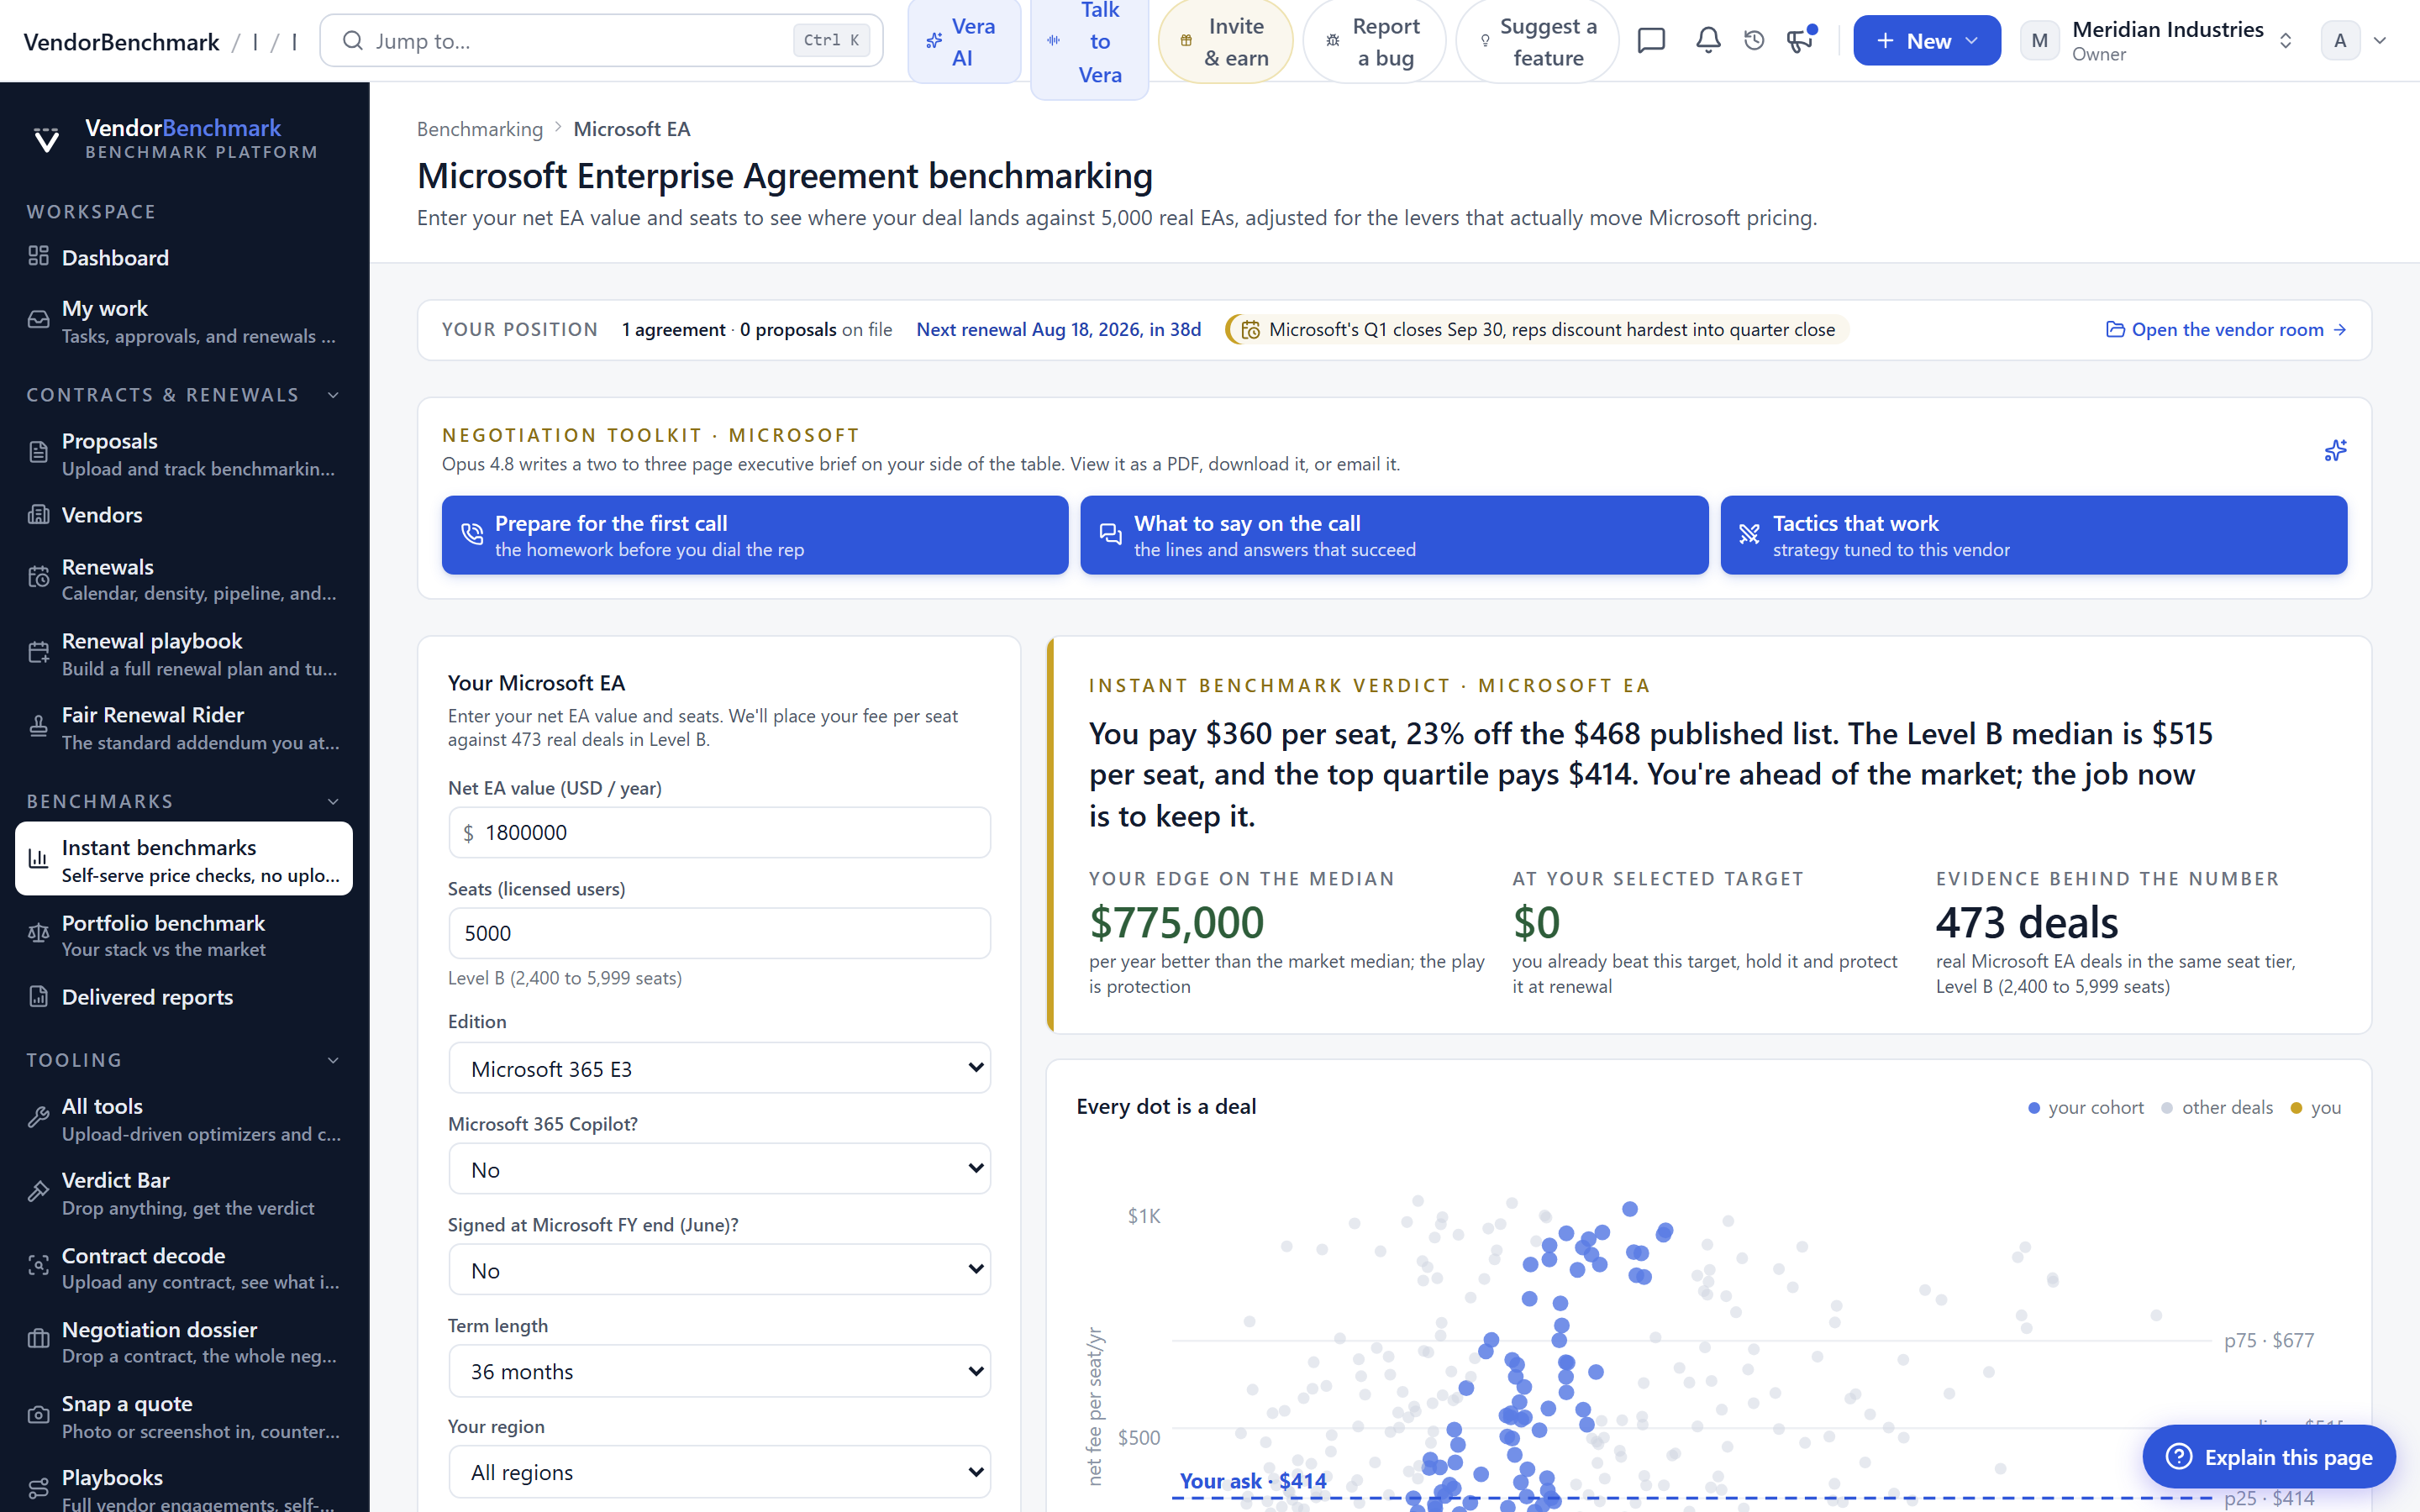
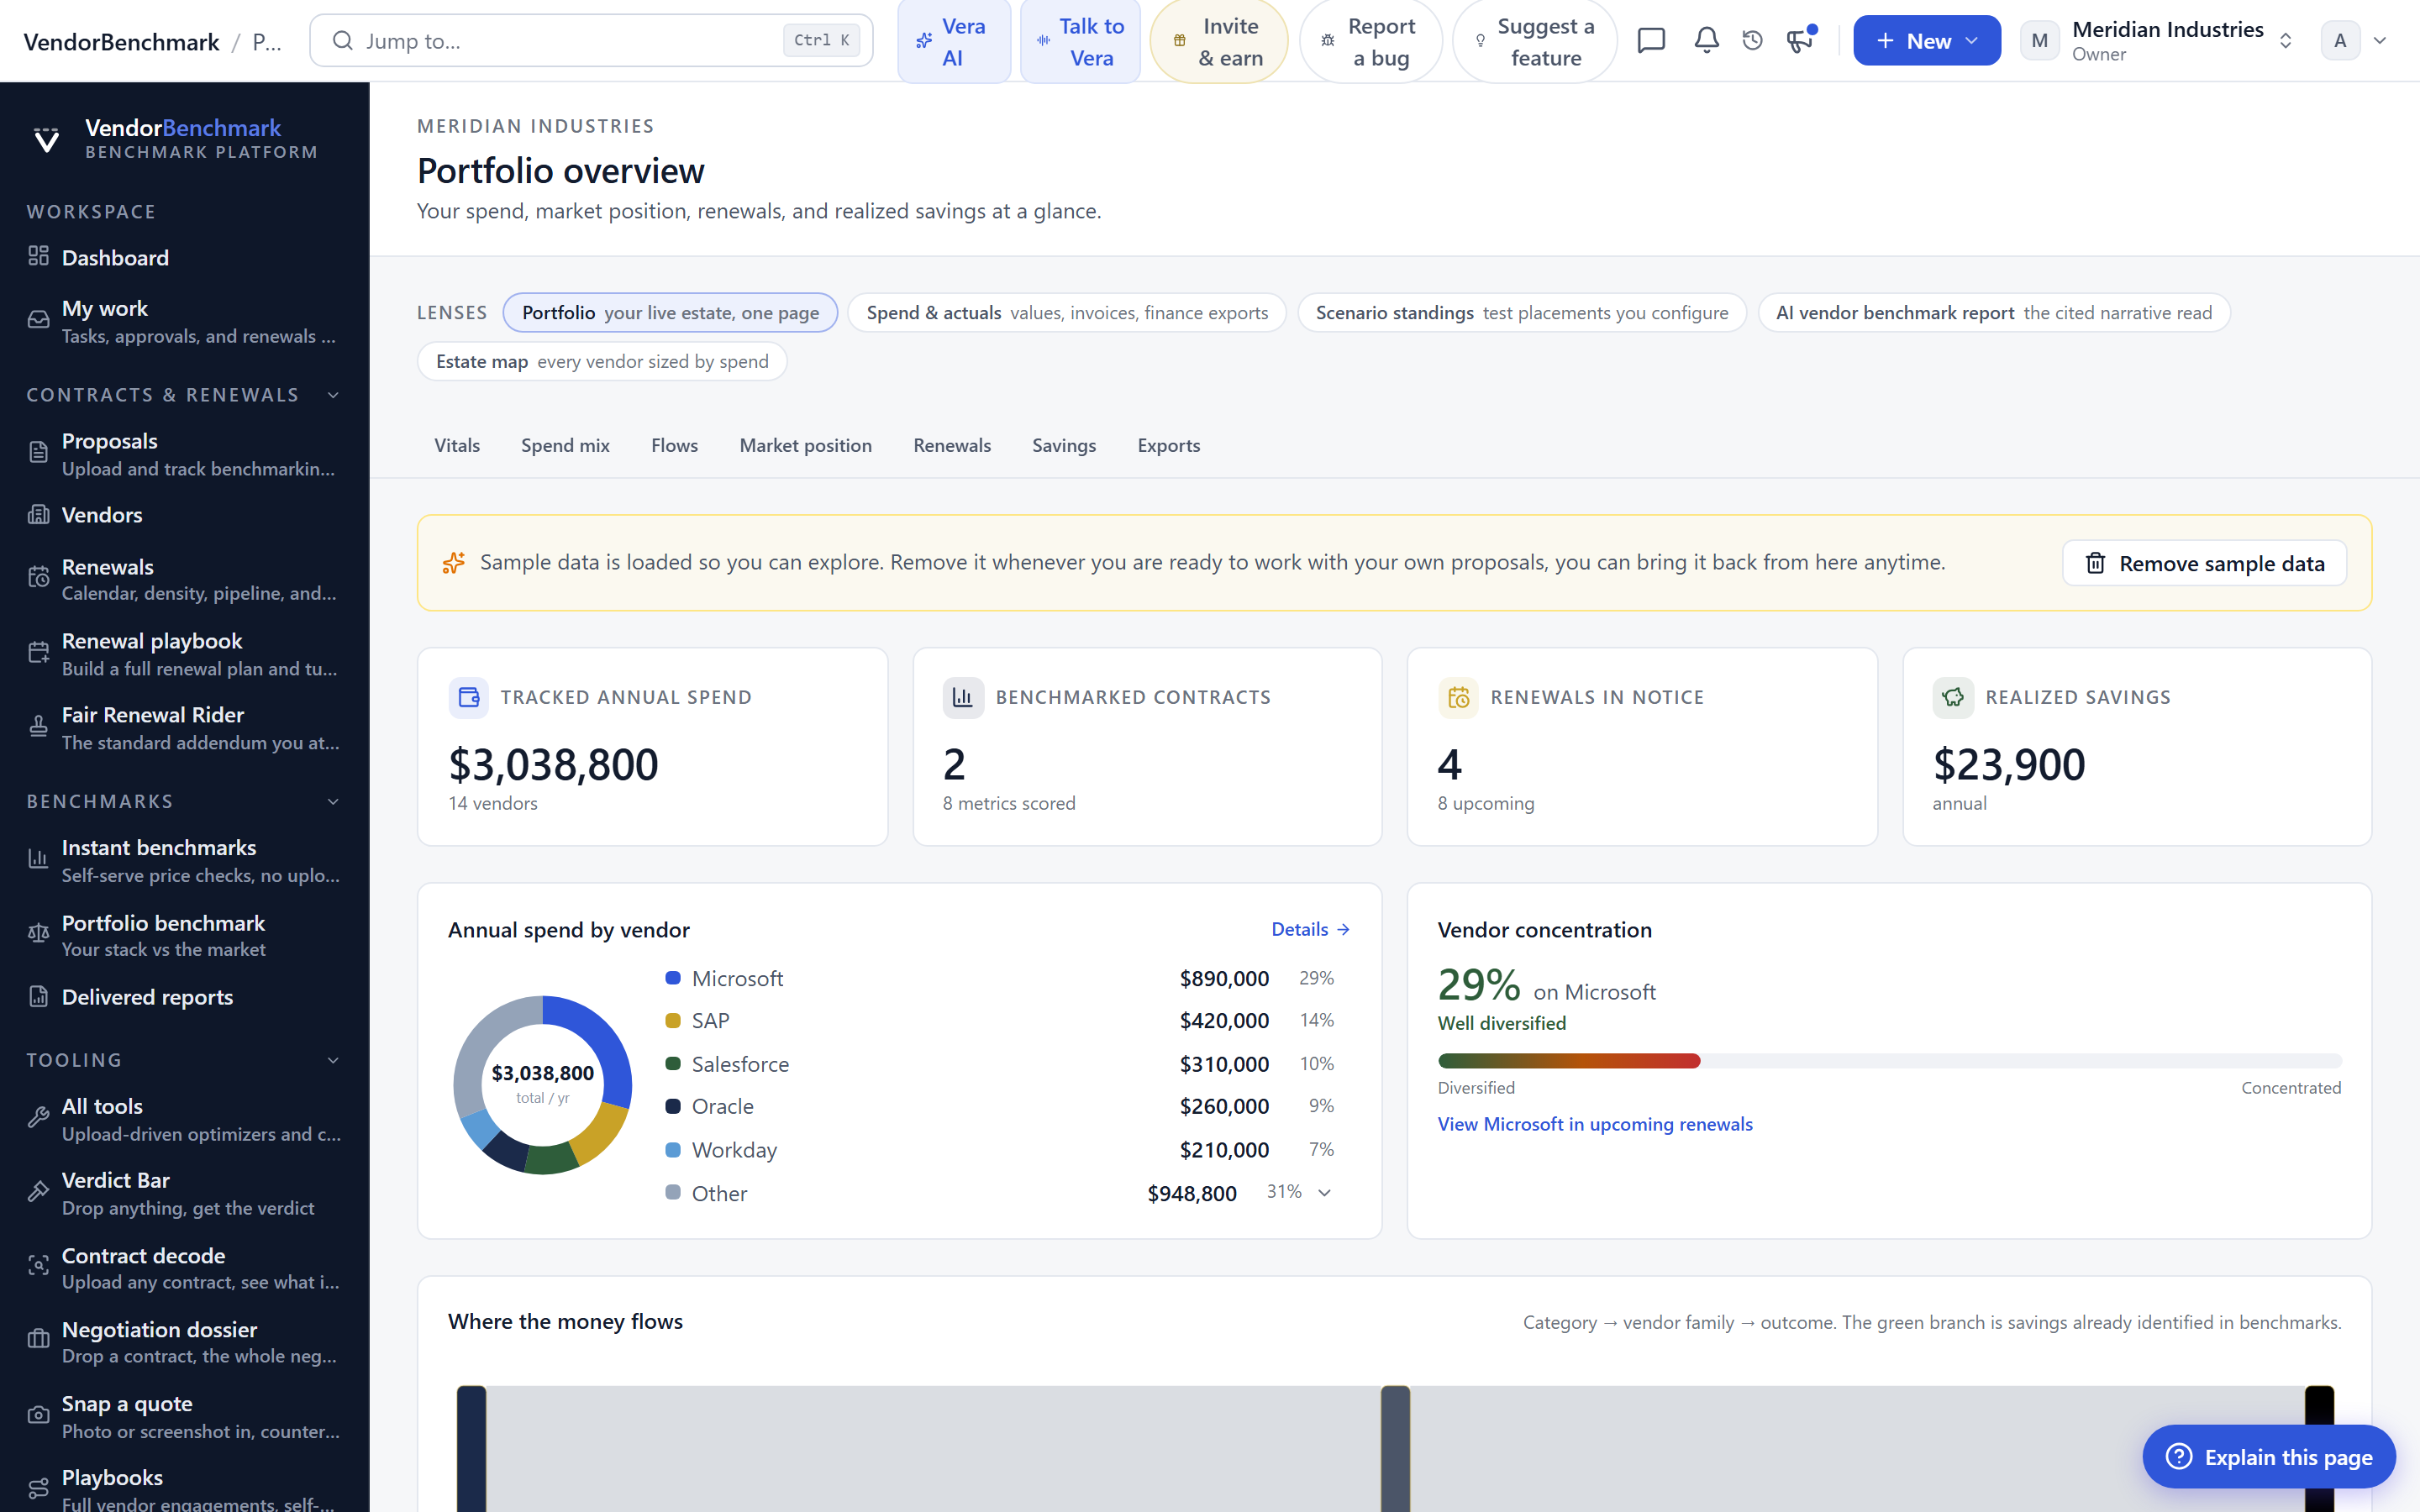
The habit that changes budgets is benchmarking the portfolio, not the deal in front of you. Every saved scenario replays against today's market, so the portfolio view ranks your whole stack by distance from market: which vendors sit above the median, what the gap is worth, and which renewal dates give you the chance to close it. The question "are we overpaying?" stops being a project and becomes a page.
The bottom line is simple. A survey tells you what people wish they had paid. A modelled deal cohort tells you where the market clears, for deals shaped like yours, this quarter. Only one of those numbers survives the moment the vendor asks, "where did you get that?"
Fredrik has spent more than twenty years in enterprise software, with time at Oracle, IBM, SAP, and Salesforce before moving to the buy side. He structured and priced the kind of large agreements most buyers only see once or twice in a career, which taught him where the leverage sits and how far a vendor will actually move. He started VendorBenchmark to hand that knowledge to every sourcing team.
The week in enterprise software buying, in one email.
What shipped on the platform, and the pricing and licensing moves worth knowing before your next renewal. One email a week, to your work address. Unsubscribe any time.