Every dollar of software spend, in one report.
What you spend by vendor, what sits above market, what the invoices overbilled, what you have saved, and where the next 24 months are heading. Built from your contracts and invoices, priced against the benchmark, in USD.
Spend, actual and forecast24 months back, 24 ahead
Spend by vendora year
From forecast to what you will actually pay.
Each step is a finding the platform already made on your paper: a price gap, idle seats, an overbilled invoice, an uncapped uplift. Close them and the forecast moves.
Sample estate, example figures. Your report is built from your own contracts and invoices.
Six views, one set of numbers.
Every view reads the same contracts, invoices and benchmarks, so the totals agree wherever you look.
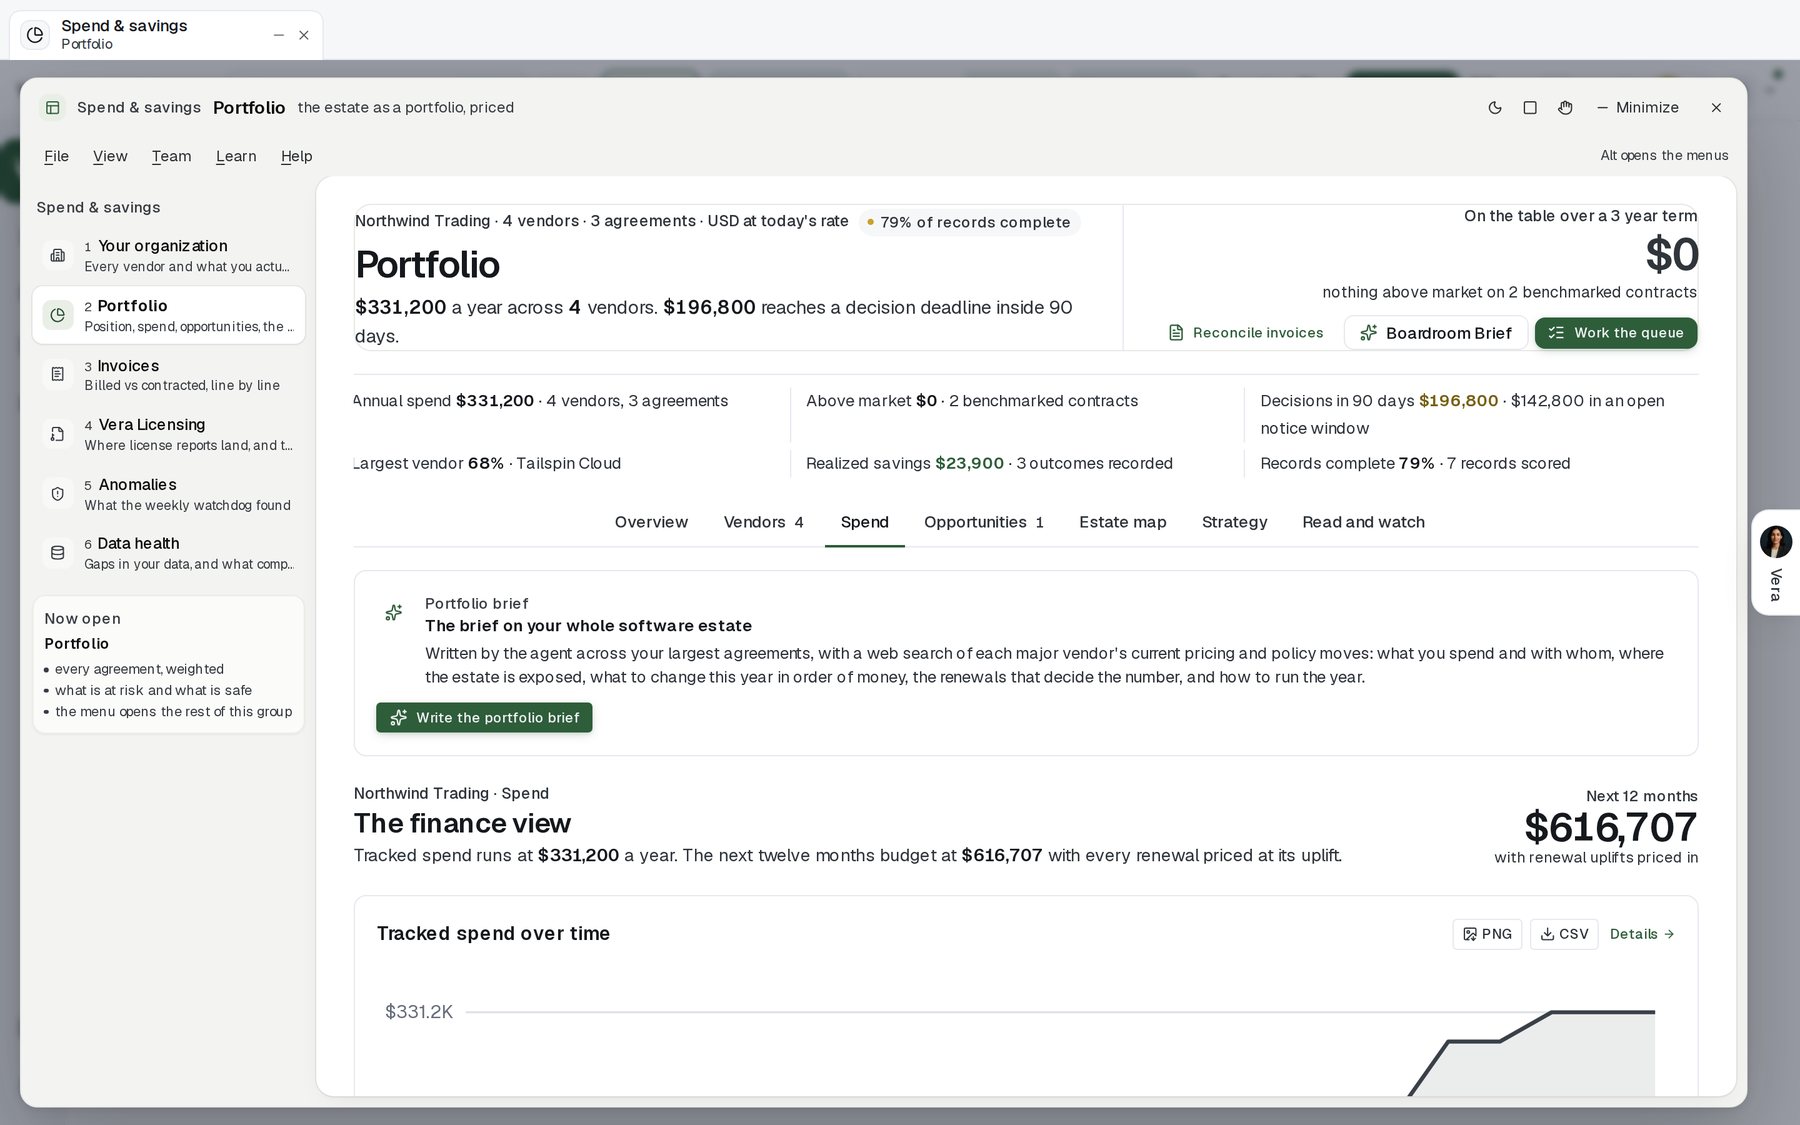
The finance view
Tracked spend today and the next twelve months, with every renewal priced at its uplift.
- Spend over time, by vendor
- Export to CSV and PNG
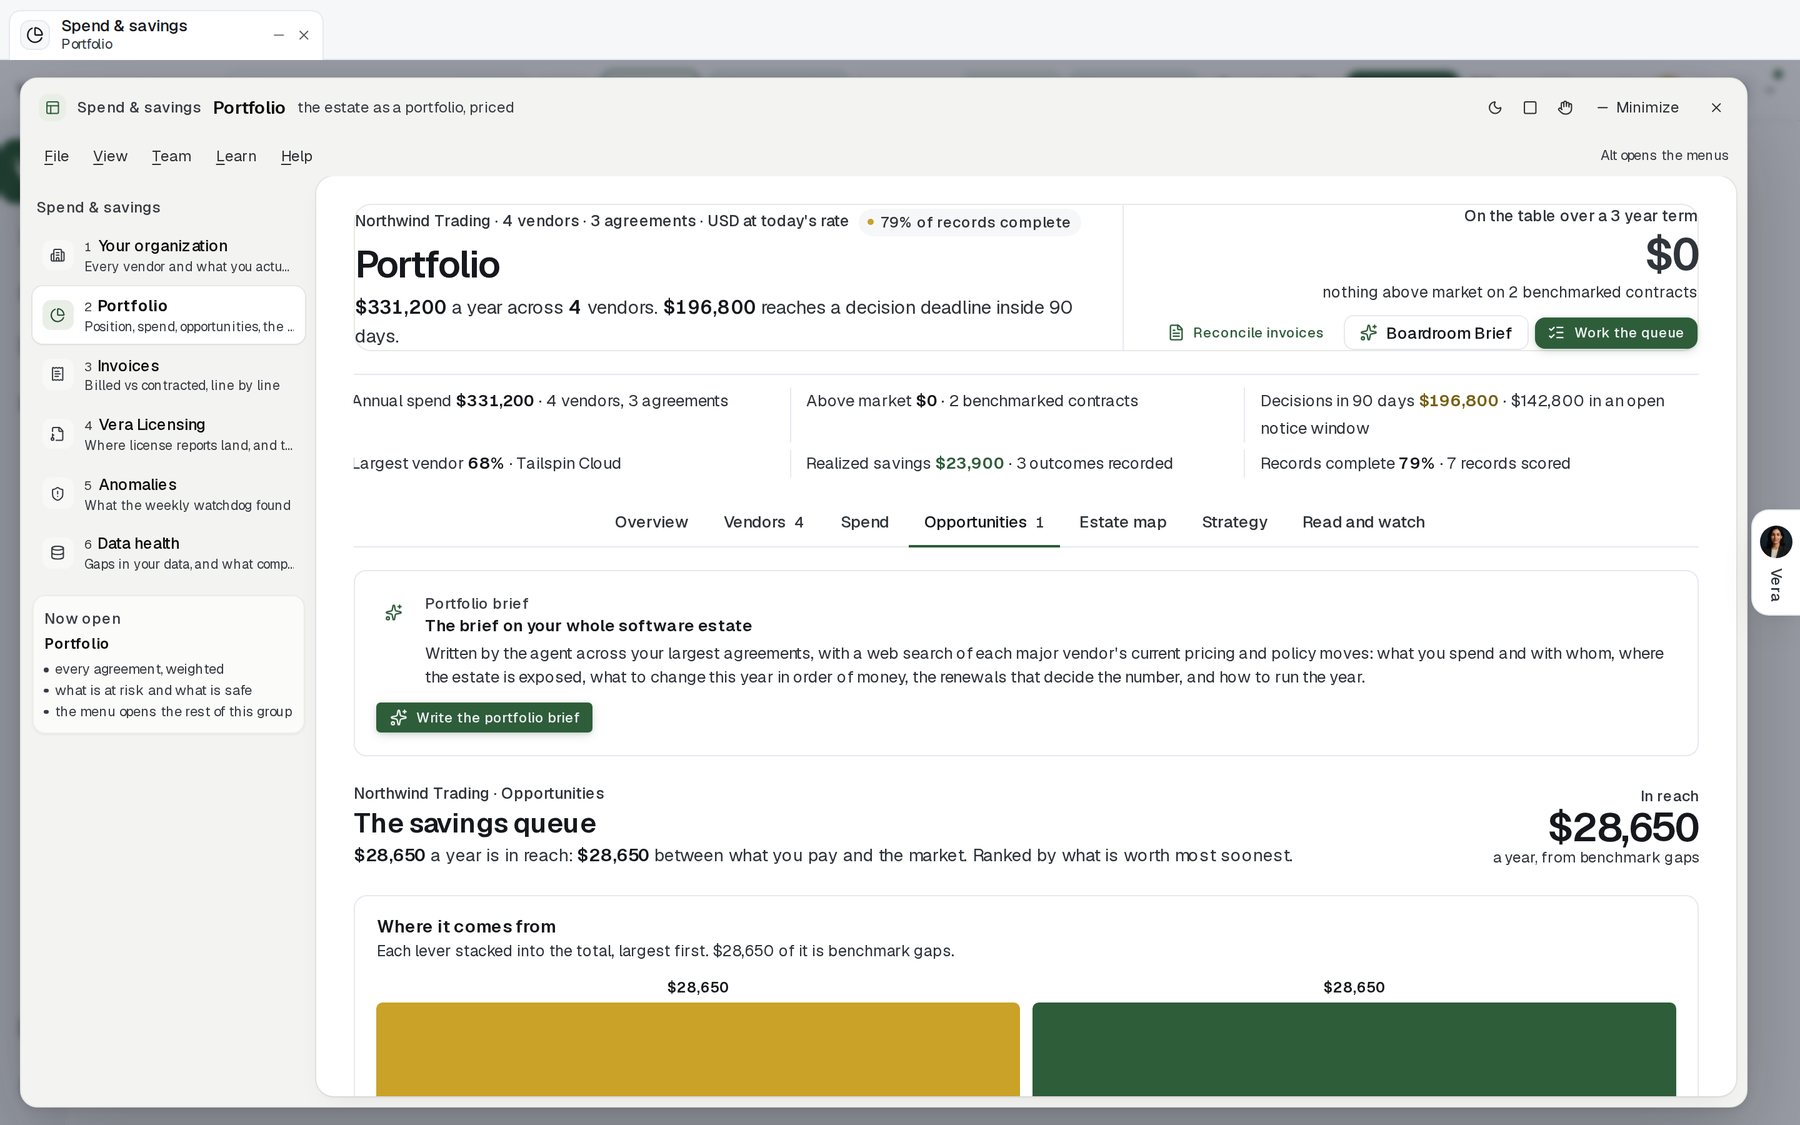
The savings queue
Every gap between what you pay and the market, ranked by what it is worth over the term.
- Largest first, in dollars
- One click into the renewal plan
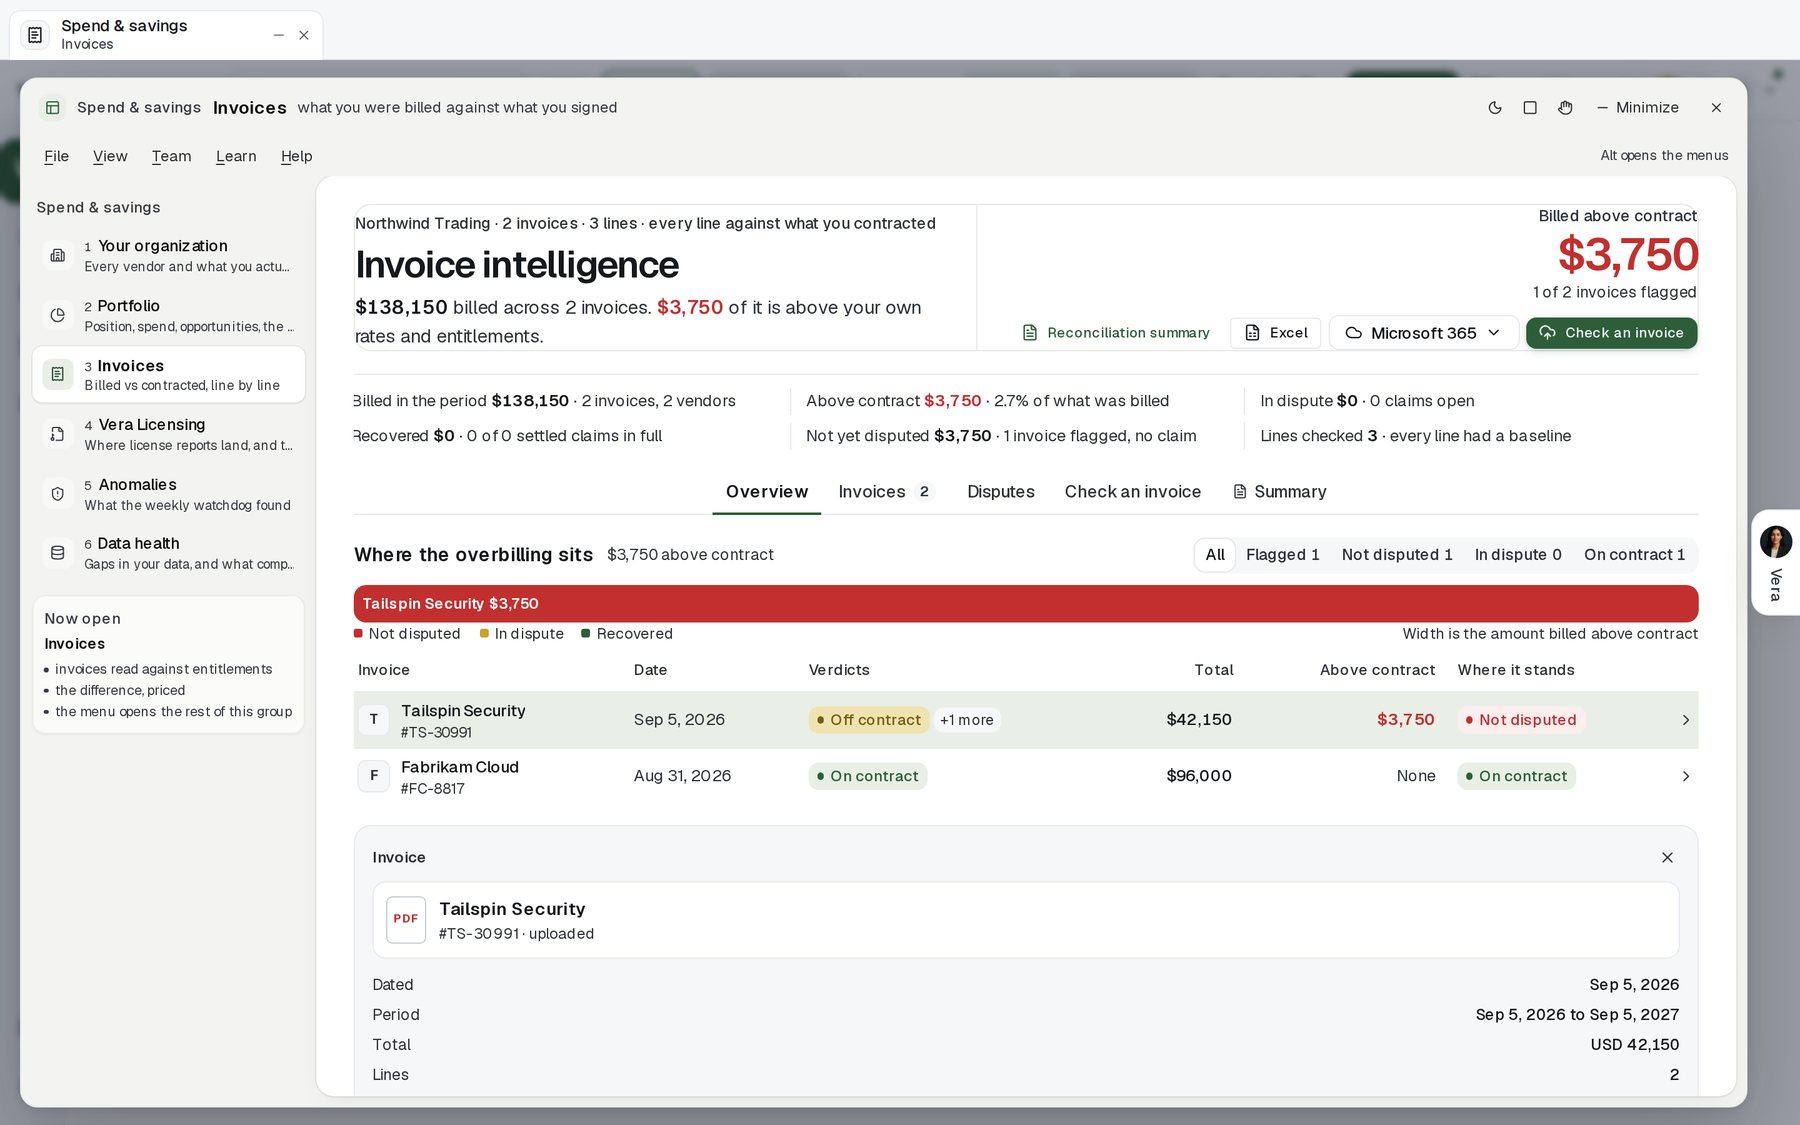
Invoice checks
Every invoice read against what you signed. Overbilling is flagged with the dispute email drafted.
- Billed against contract, line by line
- Recoveries tracked to closure
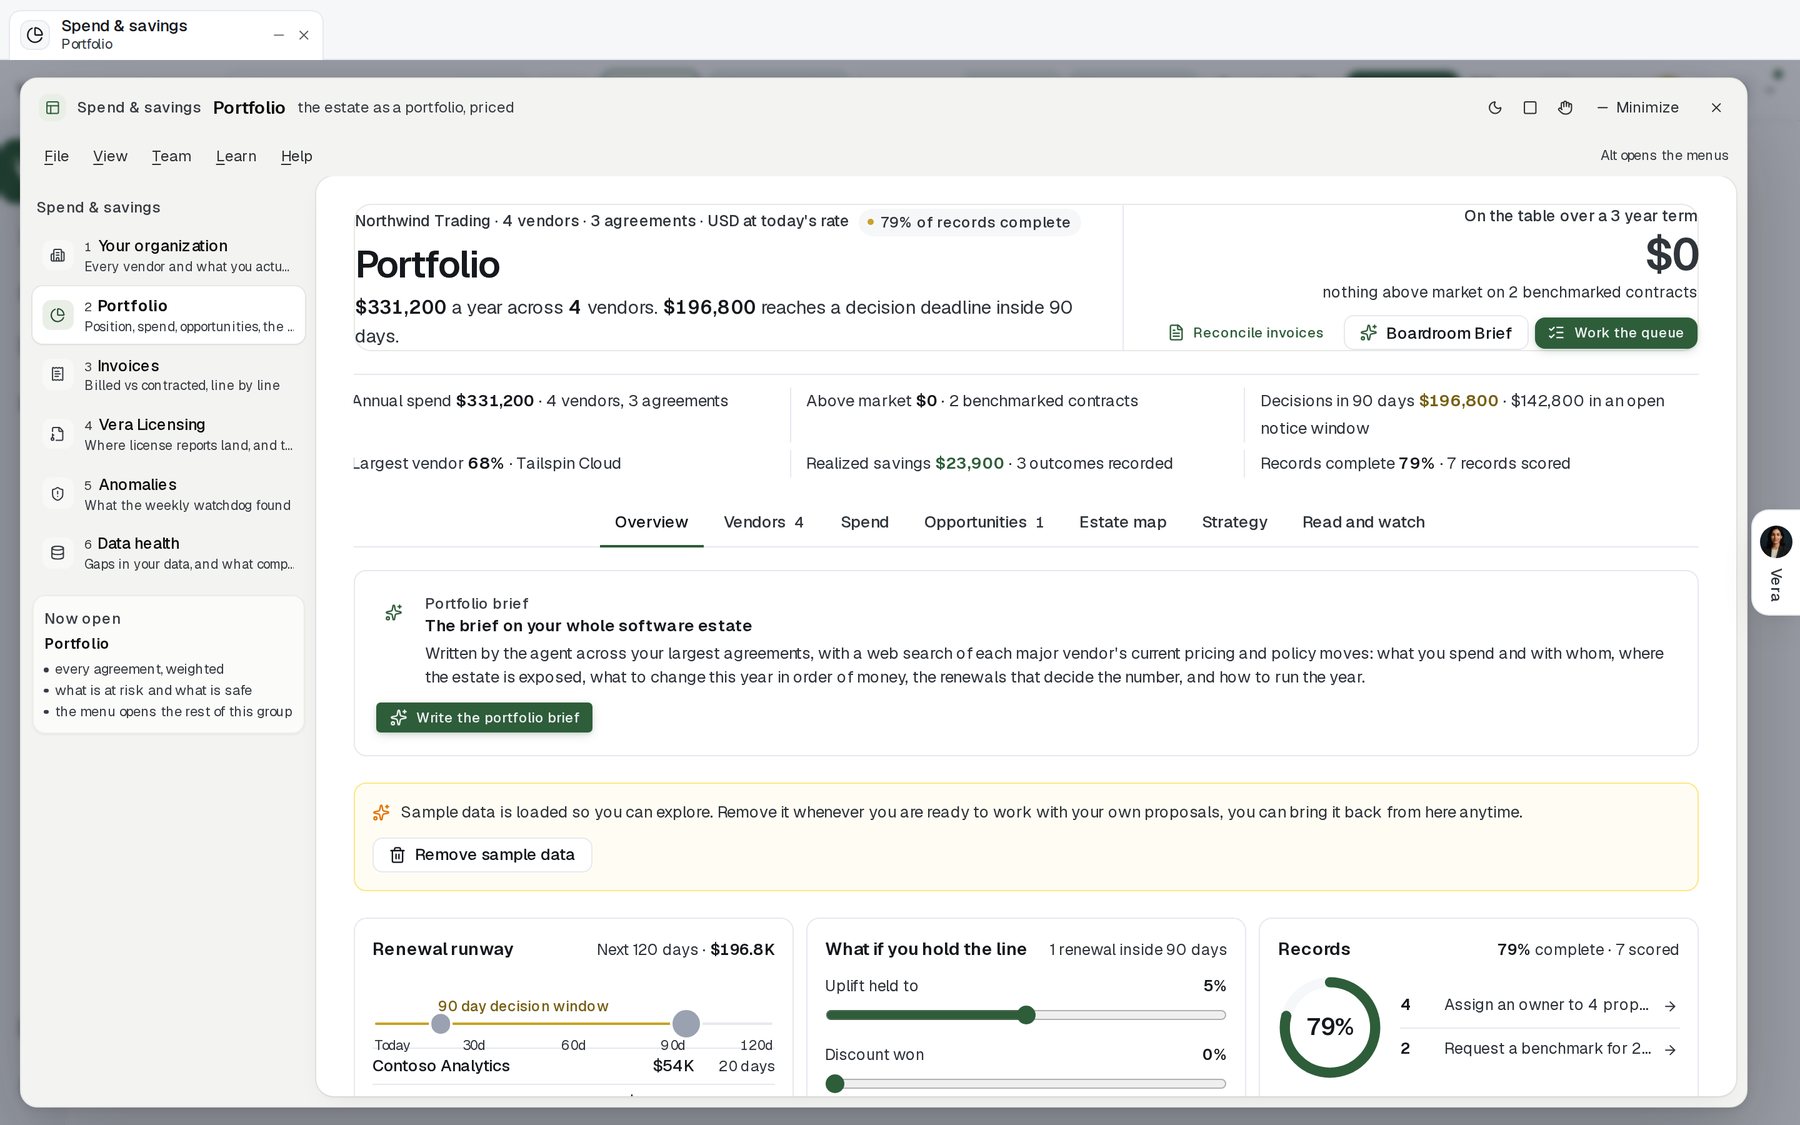
The portfolio
The whole estate priced: spend, what sits above market, and what reaches a decision deadline inside 90 days.
- Above market, by agreement
- Realized savings on the record
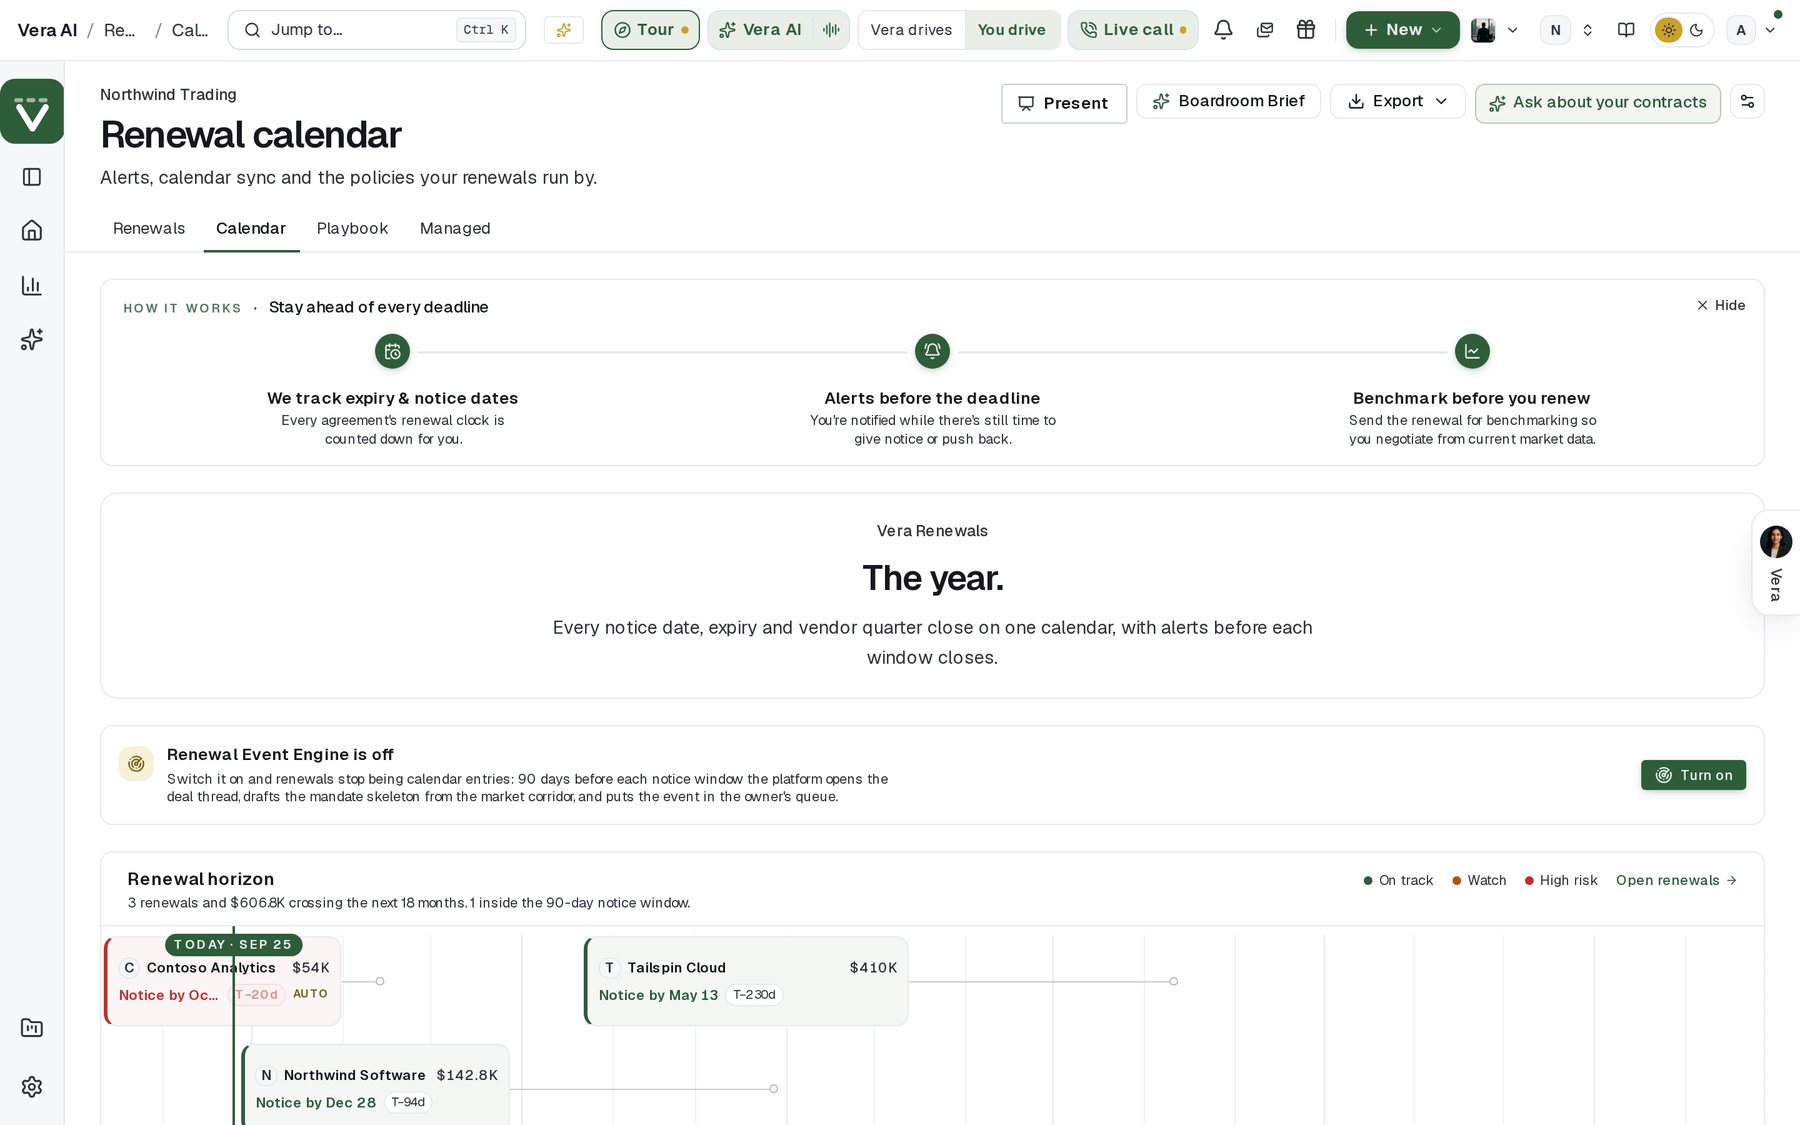
The renewal pipeline
Spend by month of renewal, so finance sees the heavy quarters before they arrive.
- Notice windows and owners
- Money at stake per quarter
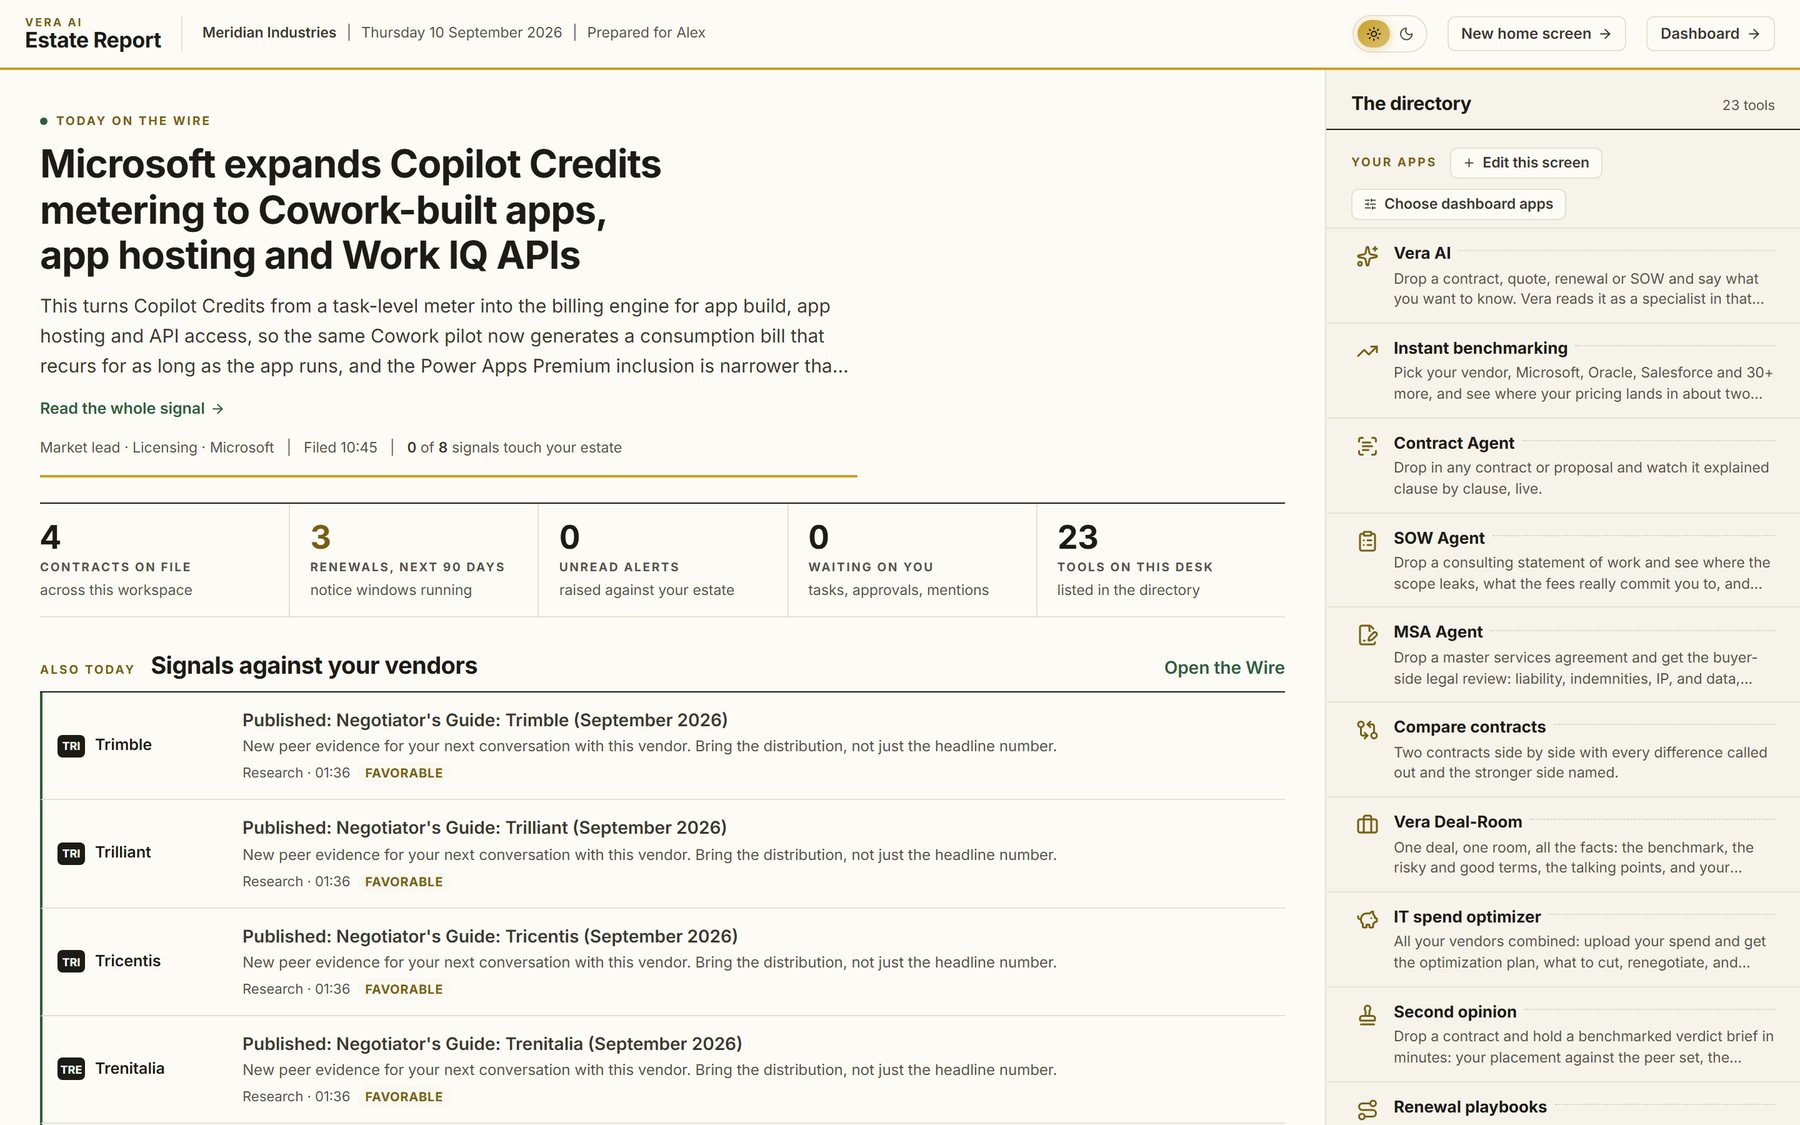
The board pack
A written report for the CFO and the board: spend, savings, risks and the renewals that matter this quarter.
- Word and PDF, in your brand
- Scheduled or on request
One report, three audiences.
The same numbers, set out for the question each reader brings.
A forecast you can budget from
Each vendor projected on its own path: its caps, its uplifts, and what the market is doing to its prices.
Where the money is
The gaps ranked by value, the renewals inside 90 days, and the recoveries still open on invoices.
What changed this quarter
Savings delivered, risks ahead and the decisions that need a sign off, on one page.
See where your money goes.
Upload your contracts and last year's invoices. The first spend report is ready the same day.