02 · Benchmarks & research
This chapter covers the benchmarking half of the platform: instant self-serve price checks for hundreds of vendors, your whole portfolio scored against the market in one view, the analyst-delivered reports you get when you upload a proposal, the vendor grade book, and the research library. Reach for it whenever you need to know whether a price is fair, where the money is across your stack, or what a vendor is doing in the market.
Benchmark Library
The library as one window, the way the contract reader is one window. You type five fields, vendor, products, contract value, industry and region, plus the offer, and the sheet answers the three questions every buyer asks in order: what discount you are being offered, what comparable customers get at your size, and where the deal ranks, in words. Then it proves it with two instruments, the discount curve and the market map.
*In plain words: pick the vendor, type what you pay and the percent off, and read the verdict. Drag the dot to see what asking for more would be worth.*
When to reach for this
- A quote has landed and you want the verdict, the range comparable buyers get, and the ask to make, in one sitting.
- You are testing an ask before the call: drag the dot and watch the money move.
- You want to compare two product lines from the same vendor against the same deal, one press apart on the shelf.
On the screen
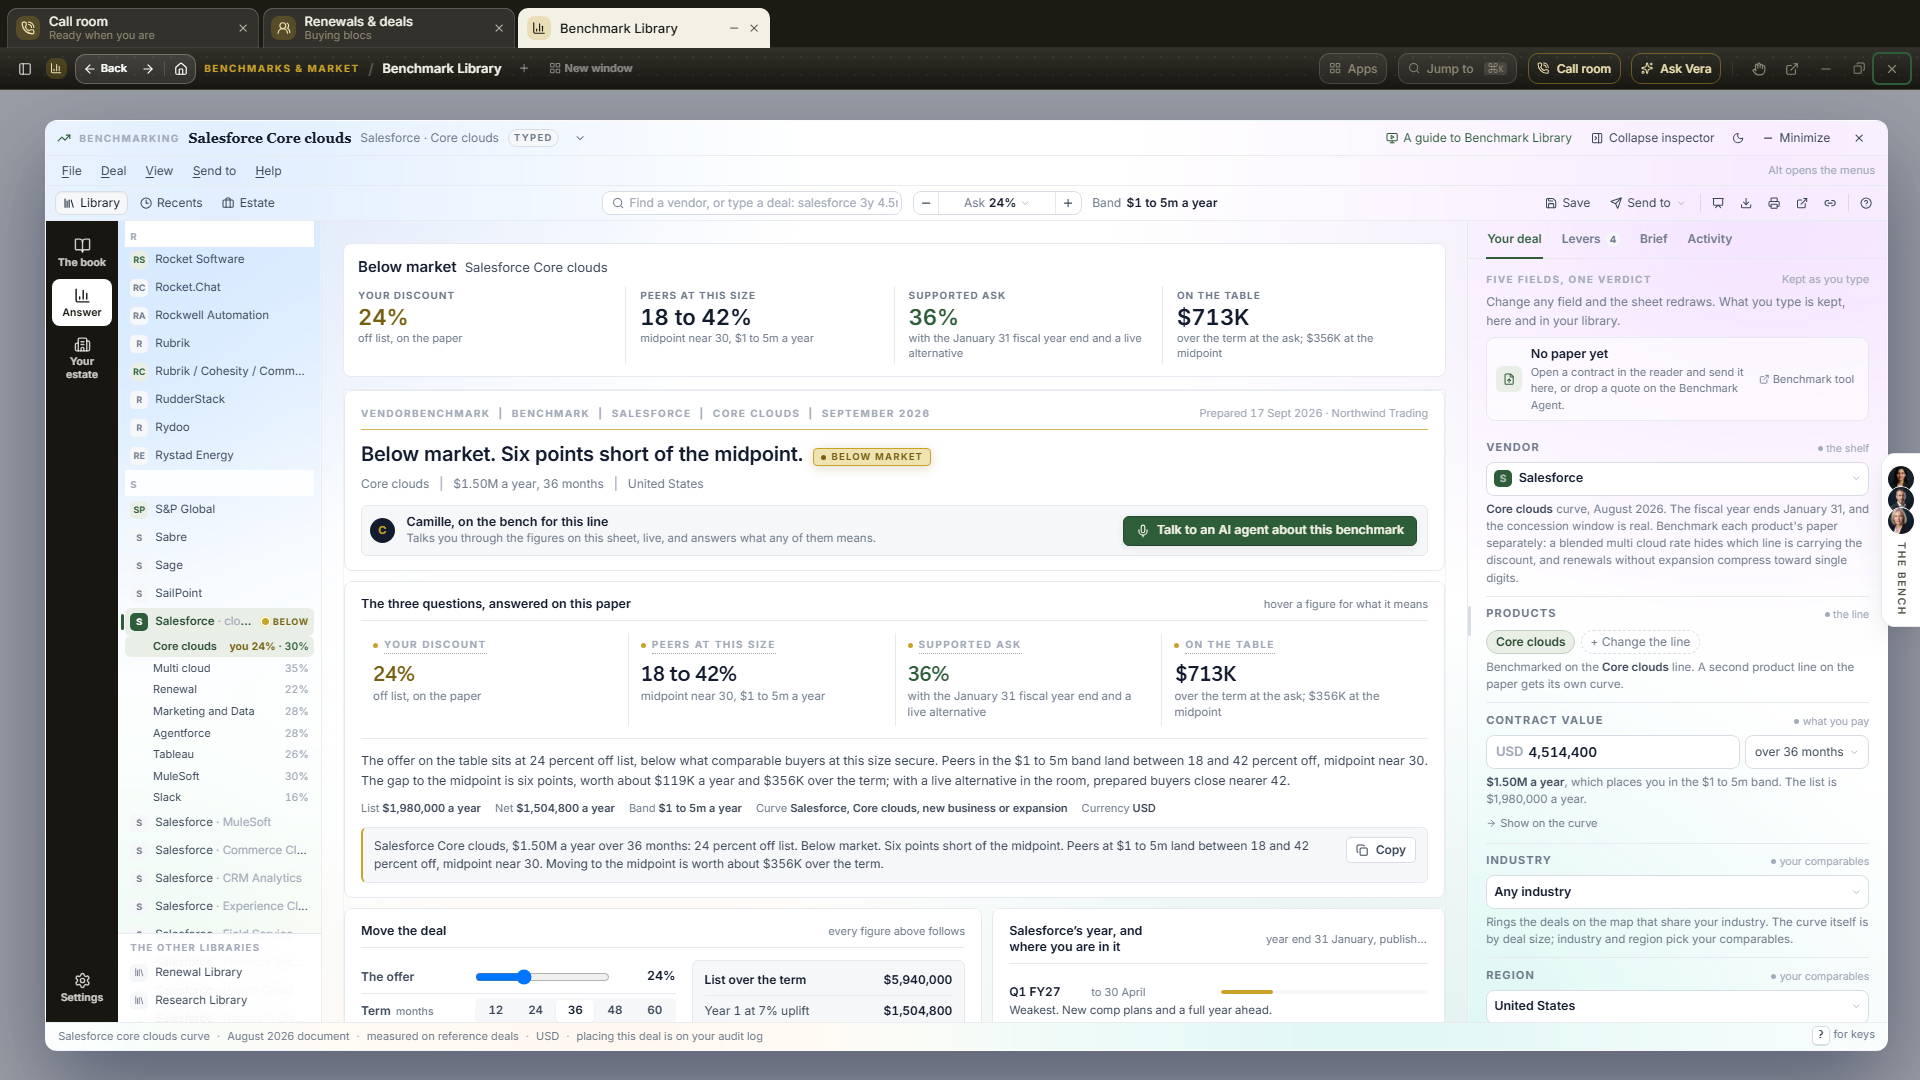
- The rail — the platform's dark rail down the left edge of the window, one icon per room with the room you are in as a white pill and Settings at the foot. The book lists every vendor your organisation holds a contract with, nearest renewal first, with the days to that renewal, the contracts on file and the standing where a benchmark exists; pressing a row opens that vendor's sheet. Answer is the benchmark itself, the sheet described below, with the vendor shelf beside it. Your estate is the saved positions sheet. Settings holds this window's own switches: dark mode, the inspector, boardroom mode and the keys, with the account's notification, appearance and member pages named underneath. A red count on The book is the number of your vendors renewing inside 90 days.
- The stake and the four figures — above the sheet, the standing in a word with the line beside it, then your discount, what peers at this size land, the supported ask and the money on the table. They are read from the same function the sheet's own masthead reads, so the top of the window and the page always agree, and they appear once the deal is placed. A line your plan does not carry shows none of them.
- The titlebar — the line that is open, the lane pill (From the paper, Typed, or Tested ask when you have moved the dot), and a Recents switcher that reopens any of the last five lines opened in your workspace. A guide to Benchmark Library plays a short film right in the window: Tom, the webinar desk's senior advisor, on how to use the library and where its edges are, with a chapter rail to jump straight to any beat (find your line, set the ask, the three answers, the curve, your deal, the honest part about accuracy, and the road from the shelf to your own paper). Collapse inspector widens the sheet; the sun and moon flips the whole workspace between light and dark (the same account theme as the switch in the top bar, remembered across devices); the × closes the window and returns you to Home, because there is no page behind it. When your book holds a dated agreement with the vendor whose line is open, a chip beside the lane pill says how many days remain to the renewal, and turns gold inside 45 days.
- The menubar — File, Deal, View, Send to and Help, a real application menu row under the titlebar. Every item is a second door to something the window already does, with the keyboard hint printed beside it: File holds save, the PDF, print, open in a new tab, copy link and close; Deal holds the quick asks (the paper, the midpoint, the supported ask, prepared buyers, each with its live percent), raise or lower the ask a point, and copy the verdict as one sentence; View switches the shelf, Recents, your estate, the advanced view, the inspector, dark mode and boardroom mode, with a check beside whatever is in force; Send to lists the same tools as the command bar's Send to; Help opens the guide, the keys, and About. Hold Alt and press the underlined letter to open a menu from the keyboard, and once one menu is open, resting the pointer on another slides straight to it.
- The command bar — Library, Recents and Estate switch what the window shows; the search finds a vendor or a product line as you type (press
/to jump to it), and it also reads a whole deal line: typesalesforce 3y 4.5m at 24and press Enter, and the vendor opens with the term, the value and the offer filled, one line instead of five fields. The ask pill shows the discount under evaluation with − and + to move it a point and a menu of quick asks (the paper, the midpoint, the supported ask, prepared buyers); the band the deal sits in; then Save, Send to, boardroom mode, the PDF, print, open in a new tab, copy link, and?for the keys. As you type a deal line, a card under the field previews what Enter will place: the line, the size and term, the peer range and midpoint at that size, the money to the midpoint over the term, and the standing in a word. - The shelf — every vendor in the library, A to Z. A vendor with a written curve document opens here, in the window, and its product lines unfold beneath it with the midpoint at your deal size beside each (a line the vendor does not offer at your size says so and stays put); every other vendor opens the same sheet right there, without the window closing and opening again, with its curve measured on its own reference deals; the address follows it, so a reload or a shared link lands on the same line. A vendor keeps a row at its own letter even when its curve is a combined one, so nothing is filed under a name you would not think to look under. The vendors in your own book carry the number of contracts you hold with them. On a plan that carries part of the library rather than all of it, every row still lists and the ones your plan does not carry wear a small lock, per line rather than per vendor: a shelf can have one line open and the rest locked. Opening a locked line draws a page that names what the line covers and what a paid plan would tell you about your own paper, instead of a verdict. The vendors you hold a saved position on sit in a Your lines group at the top, each with a gold mark and its standing in a word (Poor, Below, At market, Good, Top), and the same mark rides their row in the A to Z below; open one and the line you hold shows your own offer beside the midpoint, in gold.
- The sheet — the benchmark as an application pane, not a page: flat panes with quiet type, one 20 pixel title, figures at 22 pixels, tabular numerals. The masthead states the verdict in a sentence and a rank pill (Poor, Below market, At market, Good, Top of the market); the pane under it answers the three questions with four figures: your discount, the range peers at this size land (with the midpoint), the supported ask, and the money on the table over the term. Hover a figure for what it means. The summary, one line naming what the figures rest on (the list, the net, the band, the curve, the currency), and the verdict as one sentence with Copy sit under them.
- Talk to an AI agent about this benchmark — the filled button under the title on every open line. One press opens the specialist who owns the vendor (Camille on a Salesforce sheet) with what is on your screen already said as your first line: the line, the size, the offer and the rank, and a request to talk you through each figure and take your questions. Ask what the supported ask means, why the peers land where they do, or what the money on the table is, and the answer comes from the sheet in front of you.
- Talk it through with an AI agent — the same seat, further down the sheet, with a pane of its own: the face, the seat they hold on this vendor, and the exact figures they have been handed off the page, listed so you can see what they know before you speak. Four openers save you starting with hello: what the gap to the midpoint is worth, whether the supported ask is realistic without a competitor in the room, what this vendor trades first, and the first three sentences for the call. Each one opens the same line with that question as your first sentence. They speak on video; the switch that turns the video off is on the call, and turning it off changes nothing about what they know or say. On a line your plan does not carry, they talk about how the line is priced and the figures stay held back.
- Have a human check it — the door to the other kind of answer, because humans are still more accurate than AI. The pane says what the analyst starts from (your paper when one is on file, the five fields, and the finding above), what you answer, and the day the answer is promised back. Press Ask an analyst to check this and the human benchmark window opens with the ten questions already answered from the sheet: the vendor, the size band, the term, the discount band, and the finding itself written into the brief the analyst reads first. You answer the three only you know, where you are in the negotiation, when you need to sign and how much leverage you hold, and press Send. Ask for a call about it opens the same window with the call already requested.
- Move the deal — the what-if instrument: the offer slider, the term (12 to 60 months), the annual uplift the paper proposes and the cap you hold. Every figure on the sheet follows the offer and the term; the uplift and the cap drive the price walk beside them: each year of the term at the proposed uplift, the total, the same term with the cap, and what the cap is worth. All four are kept with the deal, so closing the window loses nothing.
- The vendor's year — the four fiscal quarters with the buyer's leverage in each, the current quarter marked, and three counts from today: the days to the quarter close, the days to the year end, and the two week window to aim the signature at. Read from the vendor's Negotiator's Guide where one is published, otherwise from the fiscal calendar the library holds for the vendor, with its grade; a vendor with neither says the calendar is not published.
- The discount curve — the documented line for the product by deal size: the midpoint in ink, the prepared buyers line dashed, the lightly negotiated line faint, and the corridor where peers land washed between them. Your deal is the dot. Drag it up or down, move the slider in the inspector, or press + and −, to test an ask; the verdict, the four figures, the talking points and the brief follow it, and the paper's own offer stays marked as a hollow dot so you can always find your way back. Hover anywhere on the curve for the three values at that size. Under the curve, the rank ladder draws the five standings as rungs at your deal's size, each with the span of discount it covers, your rung marked in gold, and the next rung priced in points and in money over the term; on a line priced as a rate the lower figure is the better rung. Under the curve heading, a supplier from one of the seven indirect categories carries a link, Read the <category> playbook, which opens that category's negotiation playbook in the research library; software vendors show no such link.
- The market map — beside the ranked comparables, every reference deal on the line as a dot: larger commitments to the right, deeper discounts above. Filled dots share your region, ringed dots share your industry too; the two chips under the map switch each on and off, and Closest to you lists the three deals nearest your size.
- Comparable deals, ranked — the reference deals in your region at your size, ranked by discount, with your own deal seated among them and every row's standing in the same five words. One line under the table states where you rank and the band the curve puts peers in.
- What moves this vendor's number — the vendor's Negotiator's Guide on the sheet: the three things that decide the outcome across the top, then a tab per section of the guide: the six factors that set the number, the calendar, the twelve month runway, the benchmarks by line, the tactics that work (five, six, seven or eight of them, as the guide's own heading says; press one to read it), the ten step playbook with what to say and what to hold out for, what most buyers miss, and the clauses to check before you sign. One thousand four hundred and twelve guides are published today, SAP, Oracle, Salesforce, ServiceNow, Adobe, Snowflake, Amazon Web Services, the Microsoft EA, Microsoft 365 Copilot, Google Cloud, IBM Software, NVIDIA, Palo Alto Networks, Red Hat, Atlassian, Cisco, Databricks, Datadog, CrowdStrike, Cloudflare, GitHub, GitLab, Okta, HashiCorp, LinkedIn, McKinsey and KPMG among them; the coming soon pane names the running count. The guide opens from the name on your paper before the name the library groups it under, so Amazon Ads, Amazon Business and Amazon Web Services each open their own, and a spelling the library groups (SFDC, Salesforce UK Limited) still lands on the publisher's. A guide written across more than one supplier opens from any of them: Anthology or Blackboard, Appian or OutSystems or Mendix, ASGN or Everforth, Braze or Iterable, Brex or Ramp, Collibra or Alation, Delinea or BeyondTrust, Duck Creek or Applied Systems, Experian or TransUnion, Fiserv or Jack Henry, Gong or Clari, ISS or Glass Lewis, Morningstar or PitchBook, Nemetschek or Bluebeam. Where a vendor has two guides, one on the relationship and one on a single subject (the fee rate at G-P, Magnit and Neeyamo, professional services at Oracle, the enterprise agreement at Palo Alto Networks), the sheet opens the first and both are in the research library. Two guides run a head to head and open from either name: Sigma or ThoughtSpot, Tipalti or BILL. Every published guide is also a paper in the research library, so the same document is on the sheet, on the vendor's record and in search. A vendor without a guide says coming soon and keeps its benchmark, and a guide published later reaches its sheet the same way.
- Read further — the vendor's negotiation dossier, its discount curve document and its call scripts (the three calls that decide the renewal, word for word, with the counters to what the account team will say), each opening the research library searched to the vendor, and the Learn articles that name the vendor. A vendor with both the current call scripts brief and an earlier original sees both in that search.
- Watch — the vendor's film series and any recorded session that names it, played on the sheet; four films at a time with All of them beside. A vendor with nothing to watch has no Watch pane.
- More on this vendor in the research library — a pane of its own under the two above, added on 12 September 2026, with a search box over what they do not carry: the research library's papers on the vendor, the vendor's negotiator's guide, the Renewal Library's own guide, the category playbook where the supplier has one, the podcast episodes that name them, and the Learn articles. Type in the box and all of it filters together, so "uplift" or "audit" or "Copilot" finds the paper, the guide and the article that say it. The count line says how many of how many are showing, All of it opens the rest, and the research library is one press away for anything the shelf does not hold. The shelf is found live for the vendor on screen, so a paper published this morning is on the sheet this afternoon. Nothing that was on the page before was moved or taken away.
- The bottom line — one sentence that says what to do, and the doors: Start the negotiation, Second opinion on the paper, Take it to the Negotiation Agent, Talk it through with the seat, and Copy the verdict, which puts the whole position on your clipboard as one sentence ready for an email.
- The other libraries — the foot of the shelf rail, pinned so it stays in view while fifteen hundred vendors scroll past it: the Renewal Library for what to do at the renewal, and the Research Library for the papers behind the curves.
- Your estate — press
e, or the Estate button, and the stage lists every line your organisation has saved a position on, priced against today's curve and ranked by the dollars still open between the offer and the supported ask. Each row carries its net a year, the offer, the ask, the standing word, and Open, which reopens the sheet on that deal. A row at or past the ask reads held, because the money there is in the renewal terms. Positions saved on tool only lines, where no documented curve exists, are listed by name underneath rather than priced. The estate sheet opens with four figures over the table: the total open a year, how many saved lines sit below At market, the nearest renewal, and how many lines are held; a Renews column follows wherever your book holds a date. The rail lists the same lines while the estate is open, ranked by open dollars with the standing and the days to each renewal, and pressing one reopens it and returns the rail to the shelf. - Boardroom mode — press
b, or the presentation button in the command bar, and the window goes to the navy stage with the four figures at poster size and the bottom line as one sentence, the same figures the sheet shows at the size a meeting reads them. Pressbor Escape to come back. - Your deal (inspector) — the five fields and the offer. Vendor searches the shelf as you type; Products shows the line and lets you change it; Contract value is what you pay over the term, with the term beside it (the band follows the yearly value); Industry and Region pick your comparables. The offer is the percent off list on the paper, or the list value over the term, from which the discount derives. On a line priced as a rate the offer field asks for that percentage, there is no list field because no list exists behind a fee, and the money field asks for the base the percentage is charged on. Save to the library writes the position as a saved scenario so it joins the portfolio roll-up; Start a new benchmark shelves this one. At the foot of the tab, Drop a quote: drag a vendor quote anywhere on the window, or browse for it, and it is read end to end and comes back as a benchmark brief in a deal desk room, the same read as Drop a quote; the deal you typed stays exactly as it was.
- Levers — the ask ladder the curve draws (midpoint, supported ask, prepared buyers, one press each), what earns each rung, the four structural terms that outlast any discount (the renewal cap in writing, rollover of unused commit, overage at the committed rate, uplift waivers on the order form), and three talking points written from your figures.
- Brief — Vera's summary, a question box that answers with the benchmark in front of her, and the exports: the PDF is the tool's own snapshot of the position, replayed on the server against the full reference set.
- Activity — the properties (the curve document, the basis, the currency, the paper if there is one) and the positions saved on this line in your organisation.
How to use it
- Open the Benchmark Library. The window opens on the shelf; press
/and type the vendor, then open it and pick the product line. - Type the contract value over the term and the percent off list on the paper (or the list value, and the discount derives). Pick your industry and region.
- Read the masthead: the rank in words, your discount, the peer range, the supported ask and the money on the table. The summary under it says where the leverage is.
- Drag the dot on the curve (or press
tfor the supported ask,mfor the midpoint,pfor prepared buyers,0to come back) and watch the verdict and the figures move. - Press Save to keep the position in your library, then Send to to carry the deal into the negotiation workflow, a Second opinion, the Negotiation Agent, Vera AI or a human analyst.
- Before the call, press Talk about this benchmark and put your questions to the vendor's own negotiator, or press Ask an analyst to check this and have a person do the benchmark by hand while you keep working.
Lines priced as a rate
Seven vendors do not quote a discount off a list price. They quote a percentage of your own money, and on those lines the low end of the range is the good outcome, not the high end.
| Vendor | What the percentage is | What good looks like |
|---|---|---|
| athenahealth | percent of collections | the lowest rate you can hold |
| accesso | percent of gross ticket value | the lowest fee you can hold |
| Xsolla | percent of gross player spend | the lowest fee you can hold |
| Pushpay | percent of giving volume, subscription plus processing | the lowest all in cost you can hold |
| Web Travel Group | percent of transaction value | the lowest contracted margin you can hold |
| Citrix | percent increase against prior spend | the smallest renewal increase you can hold |
| TIBCO | percent increase against prior spend | the smallest renewal increase you can hold |
Everything on the sheet turns with it. The worst rate on the band ranks Poor and the best ranks Top of the market. The supported ask is a lower number than the one on your paper, not a higher one. The ranked table puts the lowest rate first. The wording throughout is the vendor's own, so a collections rate is described as a percent of collections and never as a percent off. A rate keeps the tenth of a point its curve documents, so 6.5 percent of collections stays 6.5. And the gap prices against the base the percentage is charged on, your collections, your ticket value, your prior spend, which is the figure the inspector asks for on these lines.
*A worked example.* A nine provider practice is quoted 6.5 percent of collections on $2.5m of collections a year. Open athenahealth, pick the 3 to 9 providers band, type 6.5 and the $7.5m the practice collects over 36 months, and the sheet reads Poor: negotiated rates at that size land between 4 and 6.5 percent of collections, midpoint near 5, so the gap to the midpoint is 1.5 points, worth about $37,500 a year and $113K over the term, and the supported rate is 4.5.
Tips
- Read further and Watch are exactly where they were. The searchable shelf under them is an addition of 12 September 2026 and carries only what those two do not: the research papers, the guides, the podcast and the articles.
- Four keys carry the new moves:
efor your estate,afor the advanced view of the vendor you are on,bfor boardroom mode,cto copy the verdict as one sentence. All four are on the?sheet. - Type a deal line into the find field and read the preview before you press Enter:
workday 3y 6.3m at 33shows the line, the peer range and the standing under the field. - Nothing typed is lost: close the window, come back tomorrow, and the deal is where you left it. Start a new benchmark shelves the old one, the Recents switcher in the titlebar reopens the last five lines, and File, Continue where you were brings back a shelved session.
- The window works in light and dark alike: at night the sheet turns warm dark paper and every chart takes its night values. The sun and moon in the titlebar flips the whole account theme without leaving the window.
- A deep link carries the whole deal: copy link in the command bar, or open in a new tab, and a colleague opens exactly what you see.
/benchmarking?family=salesforce&line=core-clouds&value=4514400&discount=24is the shape. - Vendors whose curve bands by seats, cores or a level rather than money show a band picker under the contract value instead of deriving the band.
- Before 30 August 2026 the sheet read the seven rate and uplift lines as though a bigger number were a better deal, so a benchmark you took before that date may show a rank that has since turned over. Reopen it and the sheet reads it the right way up.
- The page of vendor cards that used to sit behind this window was retired on 25 August 2026, and with it the
?classic=1address. The whole library moved into the shelf, so nothing became harder to reach, and every vendor still has its own tool page.
A worked example. A Salesforce Sales Cloud order form offers 1,000 Enterprise seats at 24 percent off list, $4,514,400 over 36 months. Open Salesforce, pick Core clouds, type the value and 24, and the sheet reads Below market: peers at $1 to 5m a year land between 18 and 42 percent off, midpoint near 30, so the gap is six points, worth about $356K over the term, and the supported ask is 36 with the January 31 close and a live alternative in the room. Press t and the sheet reads Good at 36, with the paper's 24 still marked on the curve.
If something looks wrong
- The map says the reference deals are on a paid plan. The curve is the documented guideline and always draws; the dots behind it follow your plan's benchmark allowlist and run cap, the same gate as the classic tool pages.
- A line says "not offered" at your size. The curve document carries no cell there (a multi cloud commitment has no under $250k band, for instance); pick the line the paper is really on, or another band.
- The ranked table is empty. No reference deal in your region sits in your band on this line; switch the region to rank against another, or read the curve, which is the guideline for every region.
Related: Drop a quote · The benchmark library · Portfolio benchmark
Drop a quote
The fastest route to a benchmark: hand over the vendor's own paper instead of typing the deal in. Drop a quote, order form, renewal proposal, or signed contract onto act 1 of the Negotiation Workflow and you get back a six page negotiation brief in a deal desk room, usually in about three minutes.
*In plain words: drop the vendor's quote and get back the negotiation brief.*
When to reach for this
- The renewal quote just arrived and you want your position before you reply.
- You are walking into a pricing call this week with the order form on file.
- Someone asks "is this quote fine?" and you would rather answer with a brief than an opinion.
On the screen
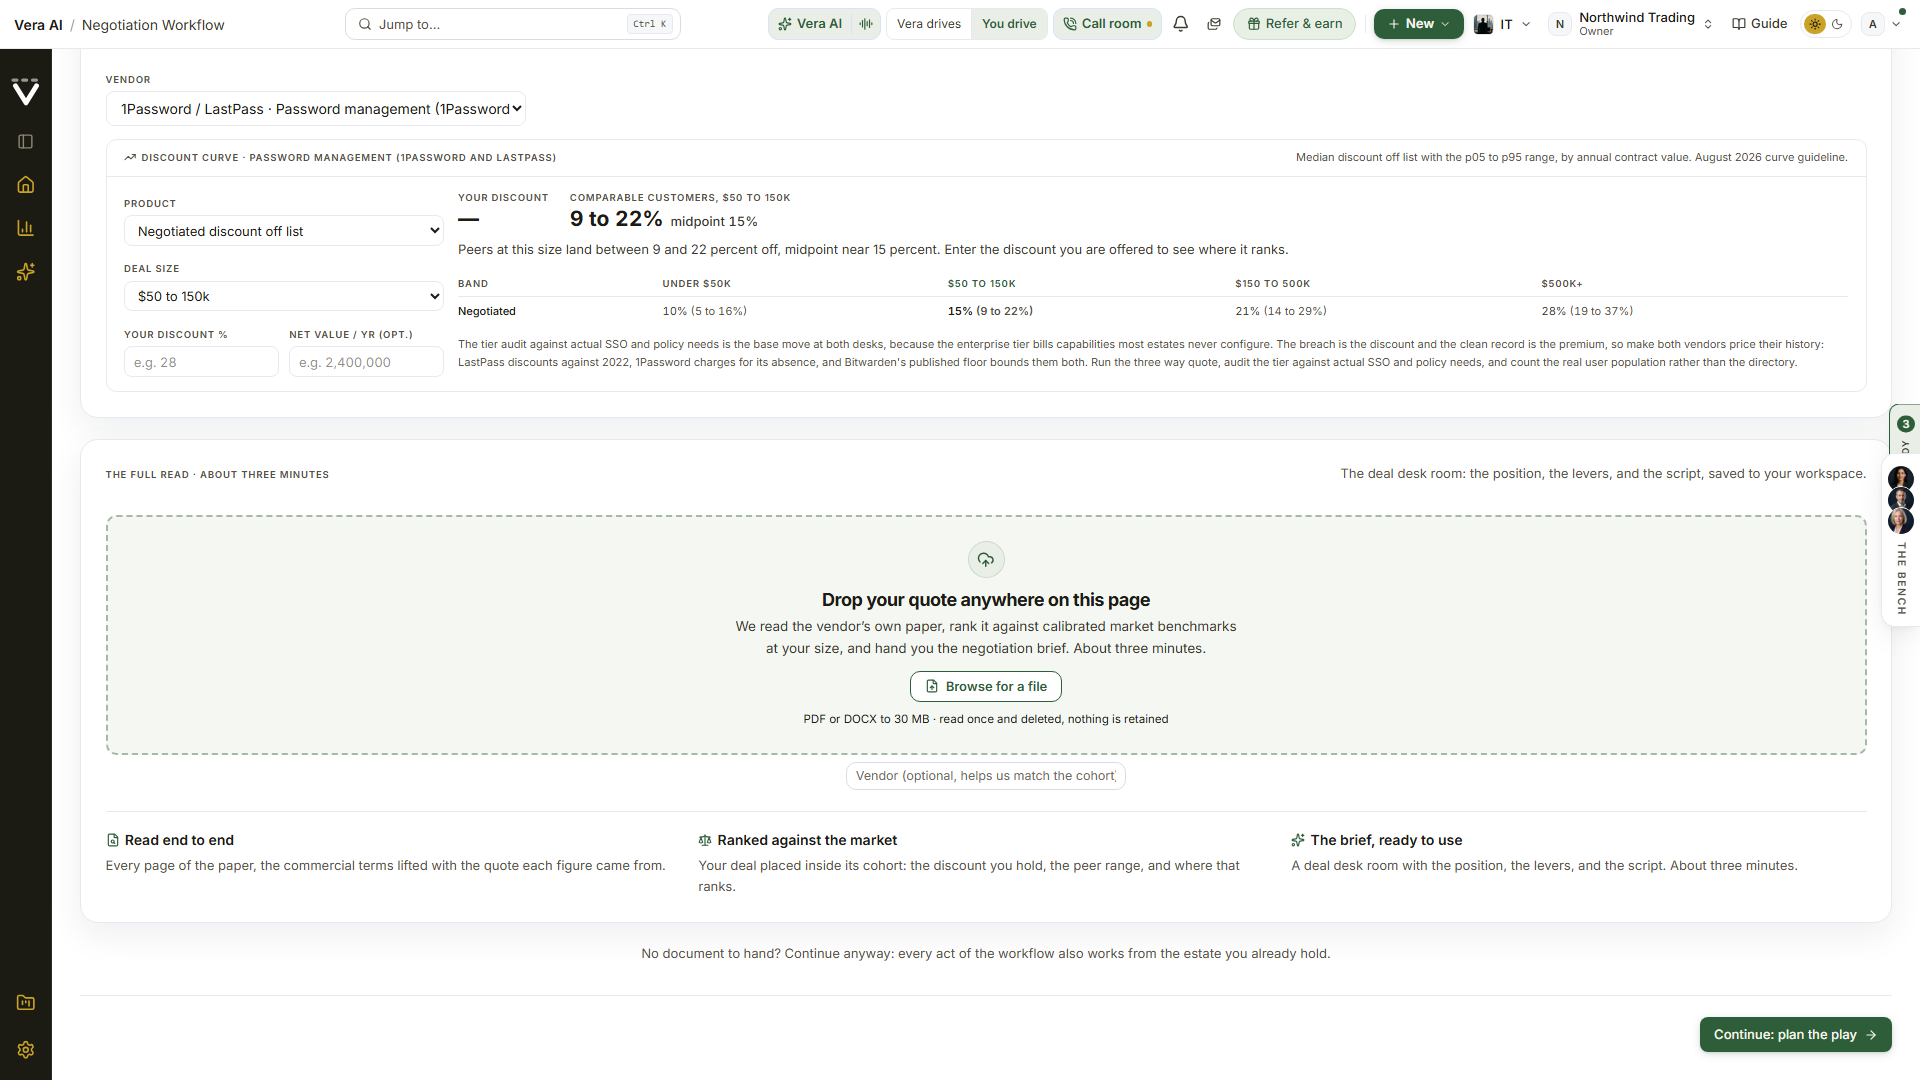
- The drop card — the dashed panel under "The full read", reading Drop your quote anywhere on this page. Click it to browse, or drag a file onto it. The line beneath states the terms: PDF or DOCX to 30 MB, read once and deleted, nothing retained.
- Drop anywhere — the whole page is the target. The moment a file enters the browser window the page dims behind a drop veil, so you never have to aim.
- Vendor field — optional, directly under the card. Naming the vendor helps us match the right cohort when the paper is ambiguous, but we read the vendor off the document either way.
- Your last brief is saved — the row below the field once this workspace has run one, naming the deal and when it ran. Continue to your benchmark takes you straight back to it.
- The run theatre — the card becomes the run, and the number on it is a real percentage rather than a spinner. Uploading your bytes drives the first tenth and the rest moves as each step of the analysis completes. The ring, the file name and the bar sit together on the left, with the eight beats in two columns beside them, reading down each column in the order they run and lighting up as they happen: uploading your document, reading the paper end to end, pulling out the commercial terms, matching comparable closed deals, ranking this deal inside its cohort, writing the position and its levers and script, checking every figure against the data, and setting the deal desk room.
- Continue to your benchmark — the button the finished run leaves behind, beside Run another document. The deal desk room renders on this act, one scroll under the lane, so the press moves you down to it rather than to another page.
How to use it
- Open act 1 of the Negotiation Workflow and go to The full read. Drag your quote or order form onto the card, or anywhere on the page, or click the card and browse. PDF or DOCX, up to 30 MB.
- Optionally type the vendor name in the field below the card.
- Watch the percentage. You can leave the page while it runs: the run follows you, the brief keeps building, and we tell you the moment it is ready.
- Press Continue to your benchmark. The finished deal desk room is already on the act, one scroll down, with the three answers, the six page case and the share rail. Copy link hands a colleague the room on its own page.
Tips
- Upload the document that carries the pricing. A master agreement with no figures gives us nothing to benchmark, and the run will tell you so rather than guessing.
- A new drop is a new deal. The working figures clear and the previous room steps aside while the new paper reads, and the outgoing review is saved under Recent reviews first, so starting over never loses work.
- Your discount is measured against a real list price wherever one exists: the one on your paper, our published price book, or one we find and cite from the vendor. Where none of those can be verified, no discount percentage is printed at all, because a percentage off a list you cannot find on your own paper reads as a measurement and is not one. The benchmark argues on the rates your paper does state, per user or per unit and the totals, against what comparable customers pay for the same product at the same size, says so plainly, and names what to have the vendor confirm in writing. The same deal returns the same figures to everyone.
- We benchmark against calibrated market benchmarks for that vendor. If the library does not hold a cohort for the vendor on your paper, the run says so plainly instead of ranking you against a near miss.
- Your file is read once and deleted. Nothing about the document is retained.
- The lane sat on the benchmarking page until 25 August 2026, when the Benchmark Library became a window with no page behind it. The drop moved to act 1 of the workflow, where the brief it produces is already the first step of the deal. To hand a paper to an analyst persona instead and get the forwardable benchmark document back, use the Benchmark Agent; it is a different read with a different deliverable.
If something looks wrong
- The card is replaced by a sentence saying the drop lane needs AI switched on for this workspace. The full read needs a plan that includes AI; the instant benchmark above it answers on your typed figures without one.
- The upload is refused: the lane takes PDF and DOCX up to 30 MB, verified by contents, and Troubleshooting covers the rejection reasons.
- The run says it cannot benchmark the paper: a master agreement with no figures gives it nothing to price. Drop the document that carries the money, usually the order form or the quote.
Related: The deal desk room · Your number (workflow act 1) · Benchmark Agent · Benchmark Library
The deal desk room
Where a finished benchmark lands, and the surface you take into the pricing round.
*In plain words: the finished brief, plus the doors that turn it into a negotiation.*
When to reach for this
- Reading the result of a dropped quote, which renders on the act as soon as it is ready.
- Coming back before the vendor call: the room stays in your workspace, so the brief is where you left it.
- Handing the position to whoever negotiates: the room is the thing to share, not a screenshot of it.
On the screen
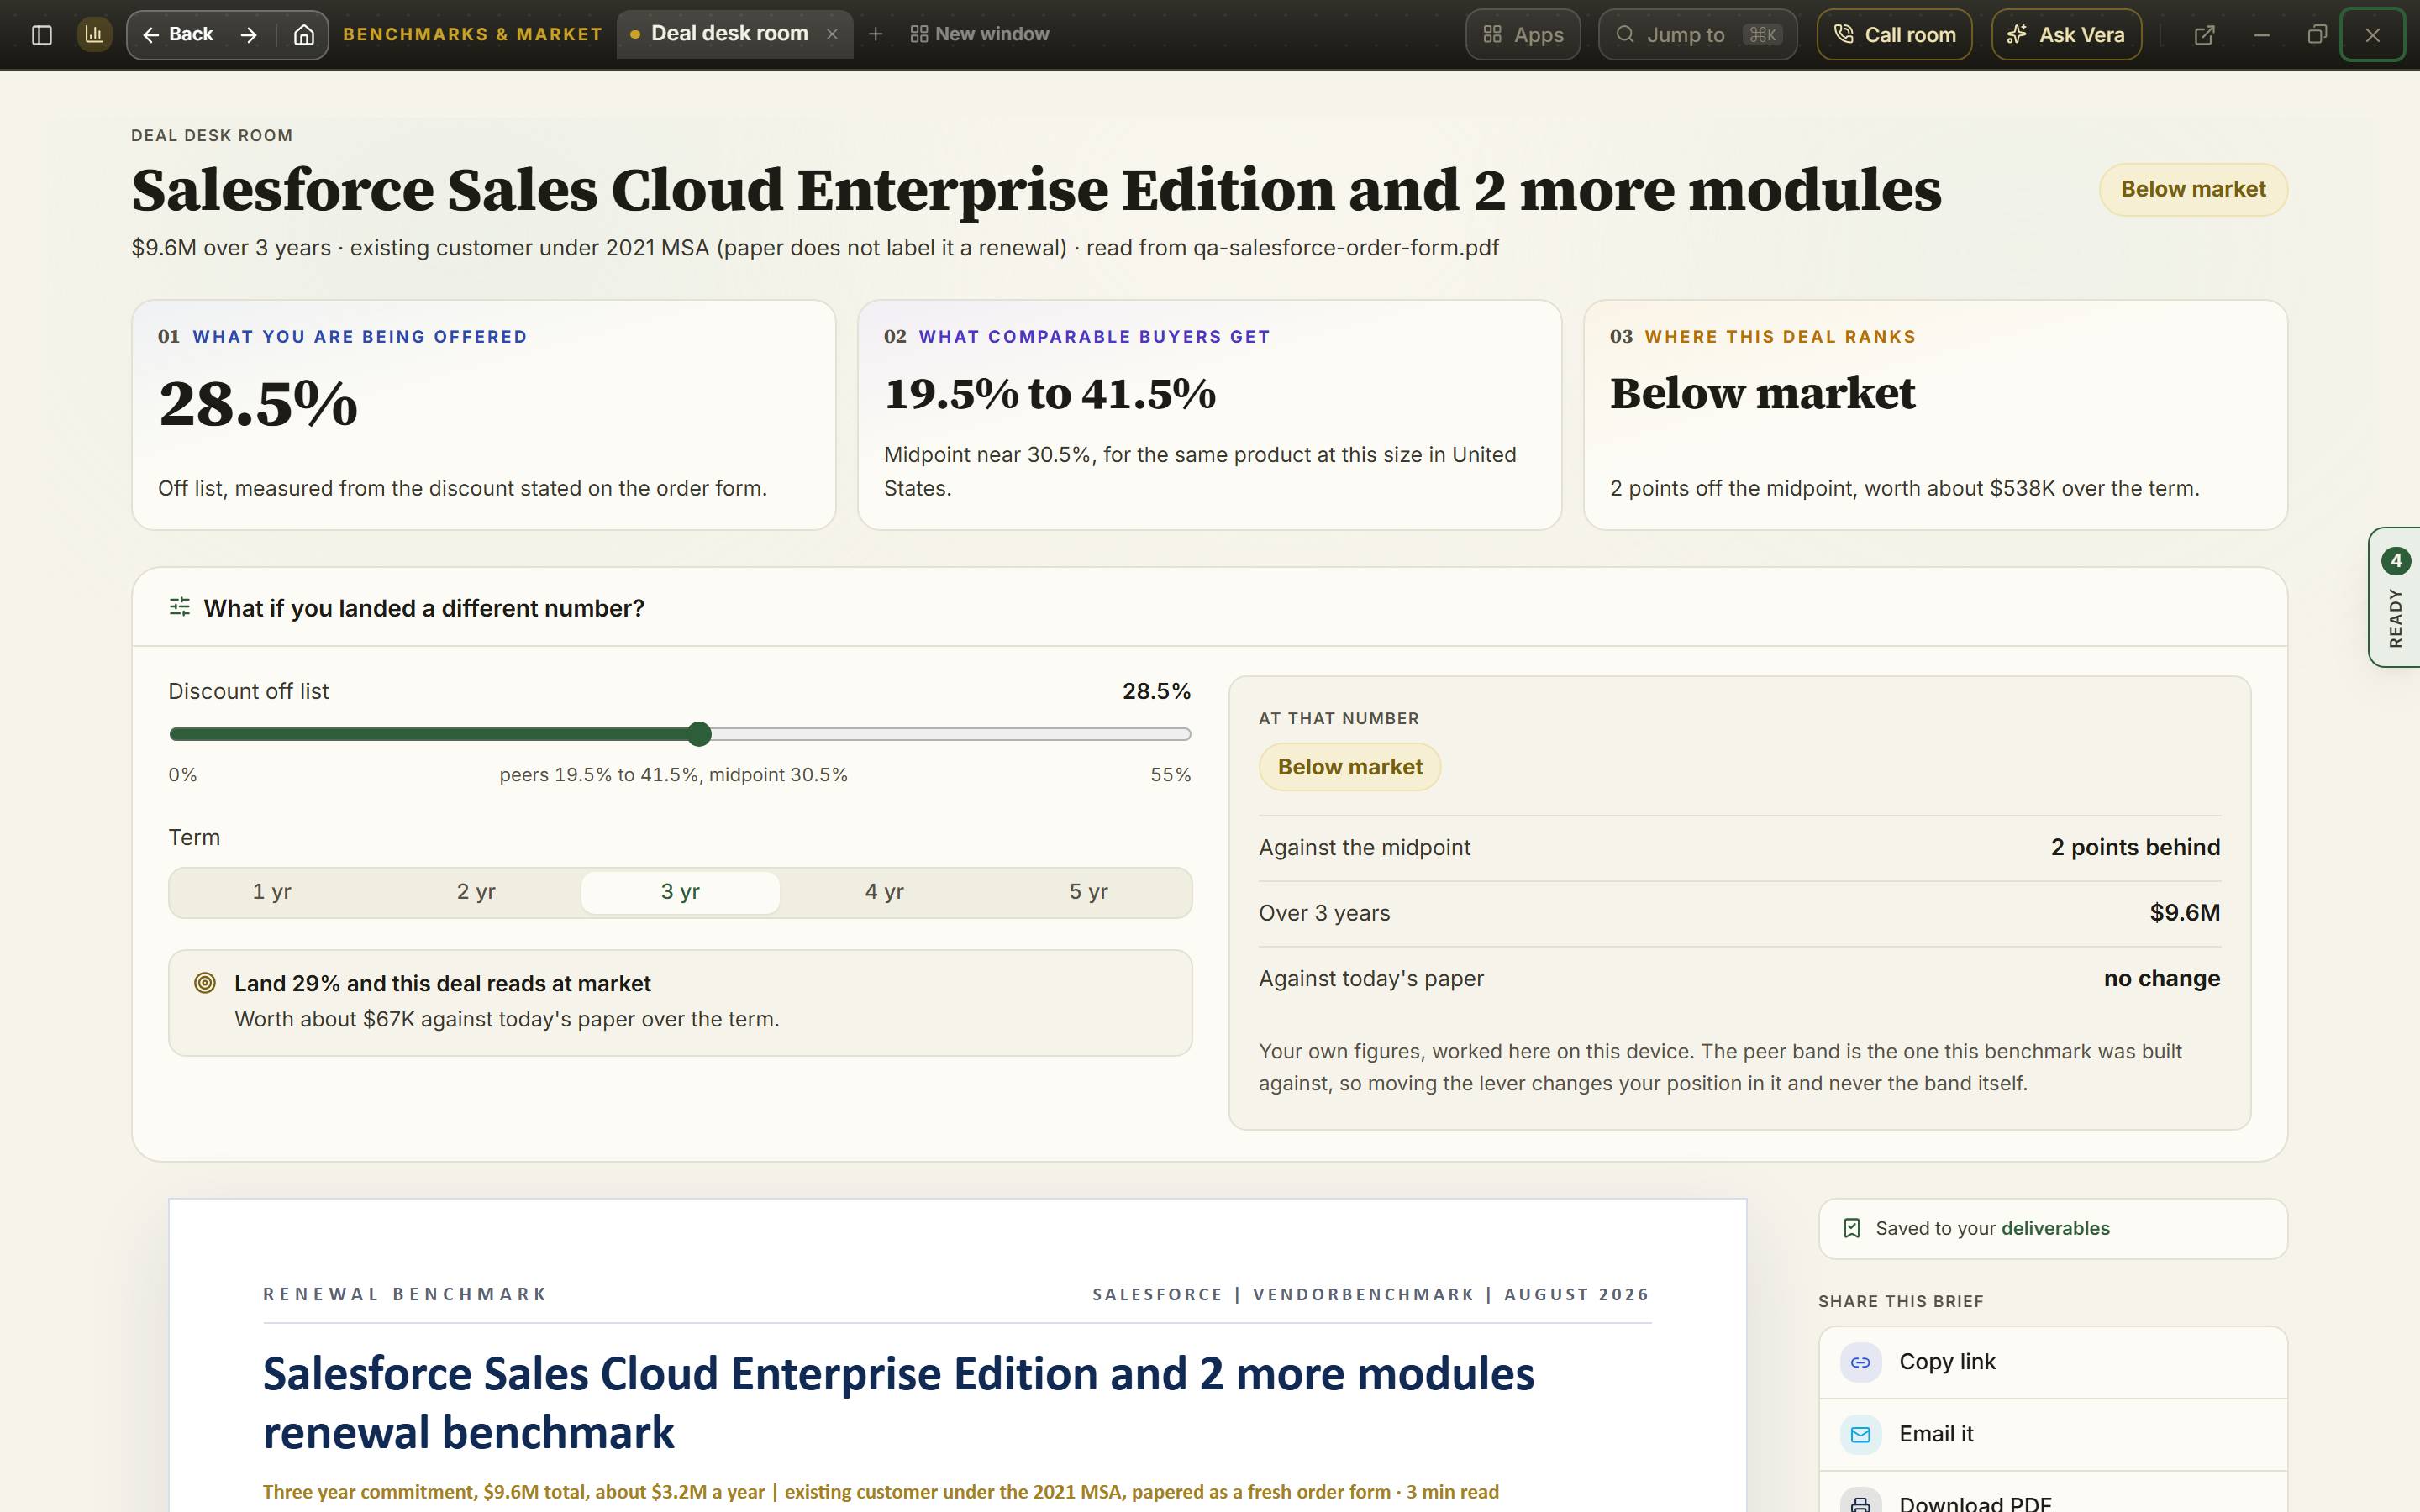
- The finding, first — the deal name in large display type with the rank beside it as a colour chip: Poor, Below market, At market, Good, or Top of the market, over one line stating the deal size, the term, and the file the figures were read from.
- The three answers — three colour tiles stating, in order, what the rest of the room argues. What discount you are being offered, in blue. What comparable buyers get, as a range with its midpoint, in violet. Where this deal ranks, in the colour of the verdict, with the gap in points and in money over the term.
- What if you landed a different number? — the instrument under the three answers, and the part most people use. Drag Discount off list (or, on a benchmark measured per unit, the net rate) and the rank word moves with it: the panel on the right restates where that number would put you, how far it sits from the peer midpoint, what the term costs at it, and whether that saves or costs against the paper you hold today. The peer range and midpoint are marked along the slider, so you can see what you are aiming at. Term switches the run between one and five years. Under the levers sits the ask, already worked out: for example *Land 32.5% and this deal reads at market*, with what reaching it is worth over the term; pressing it moves the slider there. Everything is computed on your own figures in your own browser, with no AI involved, so the same inputs always give the same answer and you can quote it in a call. Where you leave the lever is where you find it when you come back, and Back to this deal's figures returns it to the number you actually signed.
- The brief — six pages in the delivered executive brief format: executive summary, the deal snapshot against your vendor's proposal, a twelve row peer table with your own deal placed inside it by rank, cohort statistics, a sensitivity table, the market evidence behind the bands, the discount ladder, the size against rate chart, the rate alignment bridge, four levers with the order to play them, four talking points with lines you can say out loud, and the verdict.
- Next moves — three colour tiles out of the room: model the deal in the vendor's own tool, open a negotiation case, or ask Vera how to open the conversation. Above them sit the share actions: copy the room's link, email it, or download the brief as a PDF, which prints the document alone without the room around it.
How to use it
- Read the three answers at the top first. That is the finding; everything below argues it.
- Work down the brief to the levers and the sequencing note, which tells you which lever opens and which closes last.
- Before the call, set the what if panel to the number you intend to ask for, so you know what it is worth and what it makes the deal read as. The Land … line gives you the smallest ask that changes the verdict.
- Take the talking points into the call. Two of the four carry a script line in quotes.
- Use Open a negotiation case to carry the position into tracked work with a timeline and owners.
Tips
- Every peer row is a reference deal for a comparable commitment, shown by generic sub sector. No counterparty is ever named, and neither are you.
- If the brief says the rate case is closed, that is a genuine result: your rate is already at or above the market and the remaining value is in the structural terms. Play the last three levers and protect the rate.
- The what if panel never moves the peer band, only your position inside it. The band is the one this benchmark was built against, so a number you drag to is still being judged against the same market.
- A room belongs to the workspace it was made in. If you belong to more than one organization and open a room link from the other one, the page names the workspace the brief lives in and offers a one press switch; the brief then opens in place.
Related: Drop a quote · Delivered reports
Portfolio benchmark
Your whole software stack compared with the market in one view: which vendors look expensive, which look fair, and where the money is. Pressing it starts the app: the executive view opens as its own window with nothing behind it.
*In plain words: every vendor you hold, ranked by how far off the market it sits.*
When to reach for this
- "Where should this quarter's negotiation effort go?" answered by money rather than instinct.
- Before budget season, when the savings prize number frames the plan.
- After loading the estate, as the first read of what the paper says in aggregate.
A worked example. The sample portfolio carries four vendors worth $331,200 a year together. The roll-up shows one clearly above market, the Northwind CRM subscription with $28,650 a year in reach across its seat price and discount gaps, and one clearly market-leading, the Fabrikam cloud commit, where the work is defending the position rather than repairing it. That contrast is the point of the page: it separates the deals worth a fight from the deals worth a thank-you.
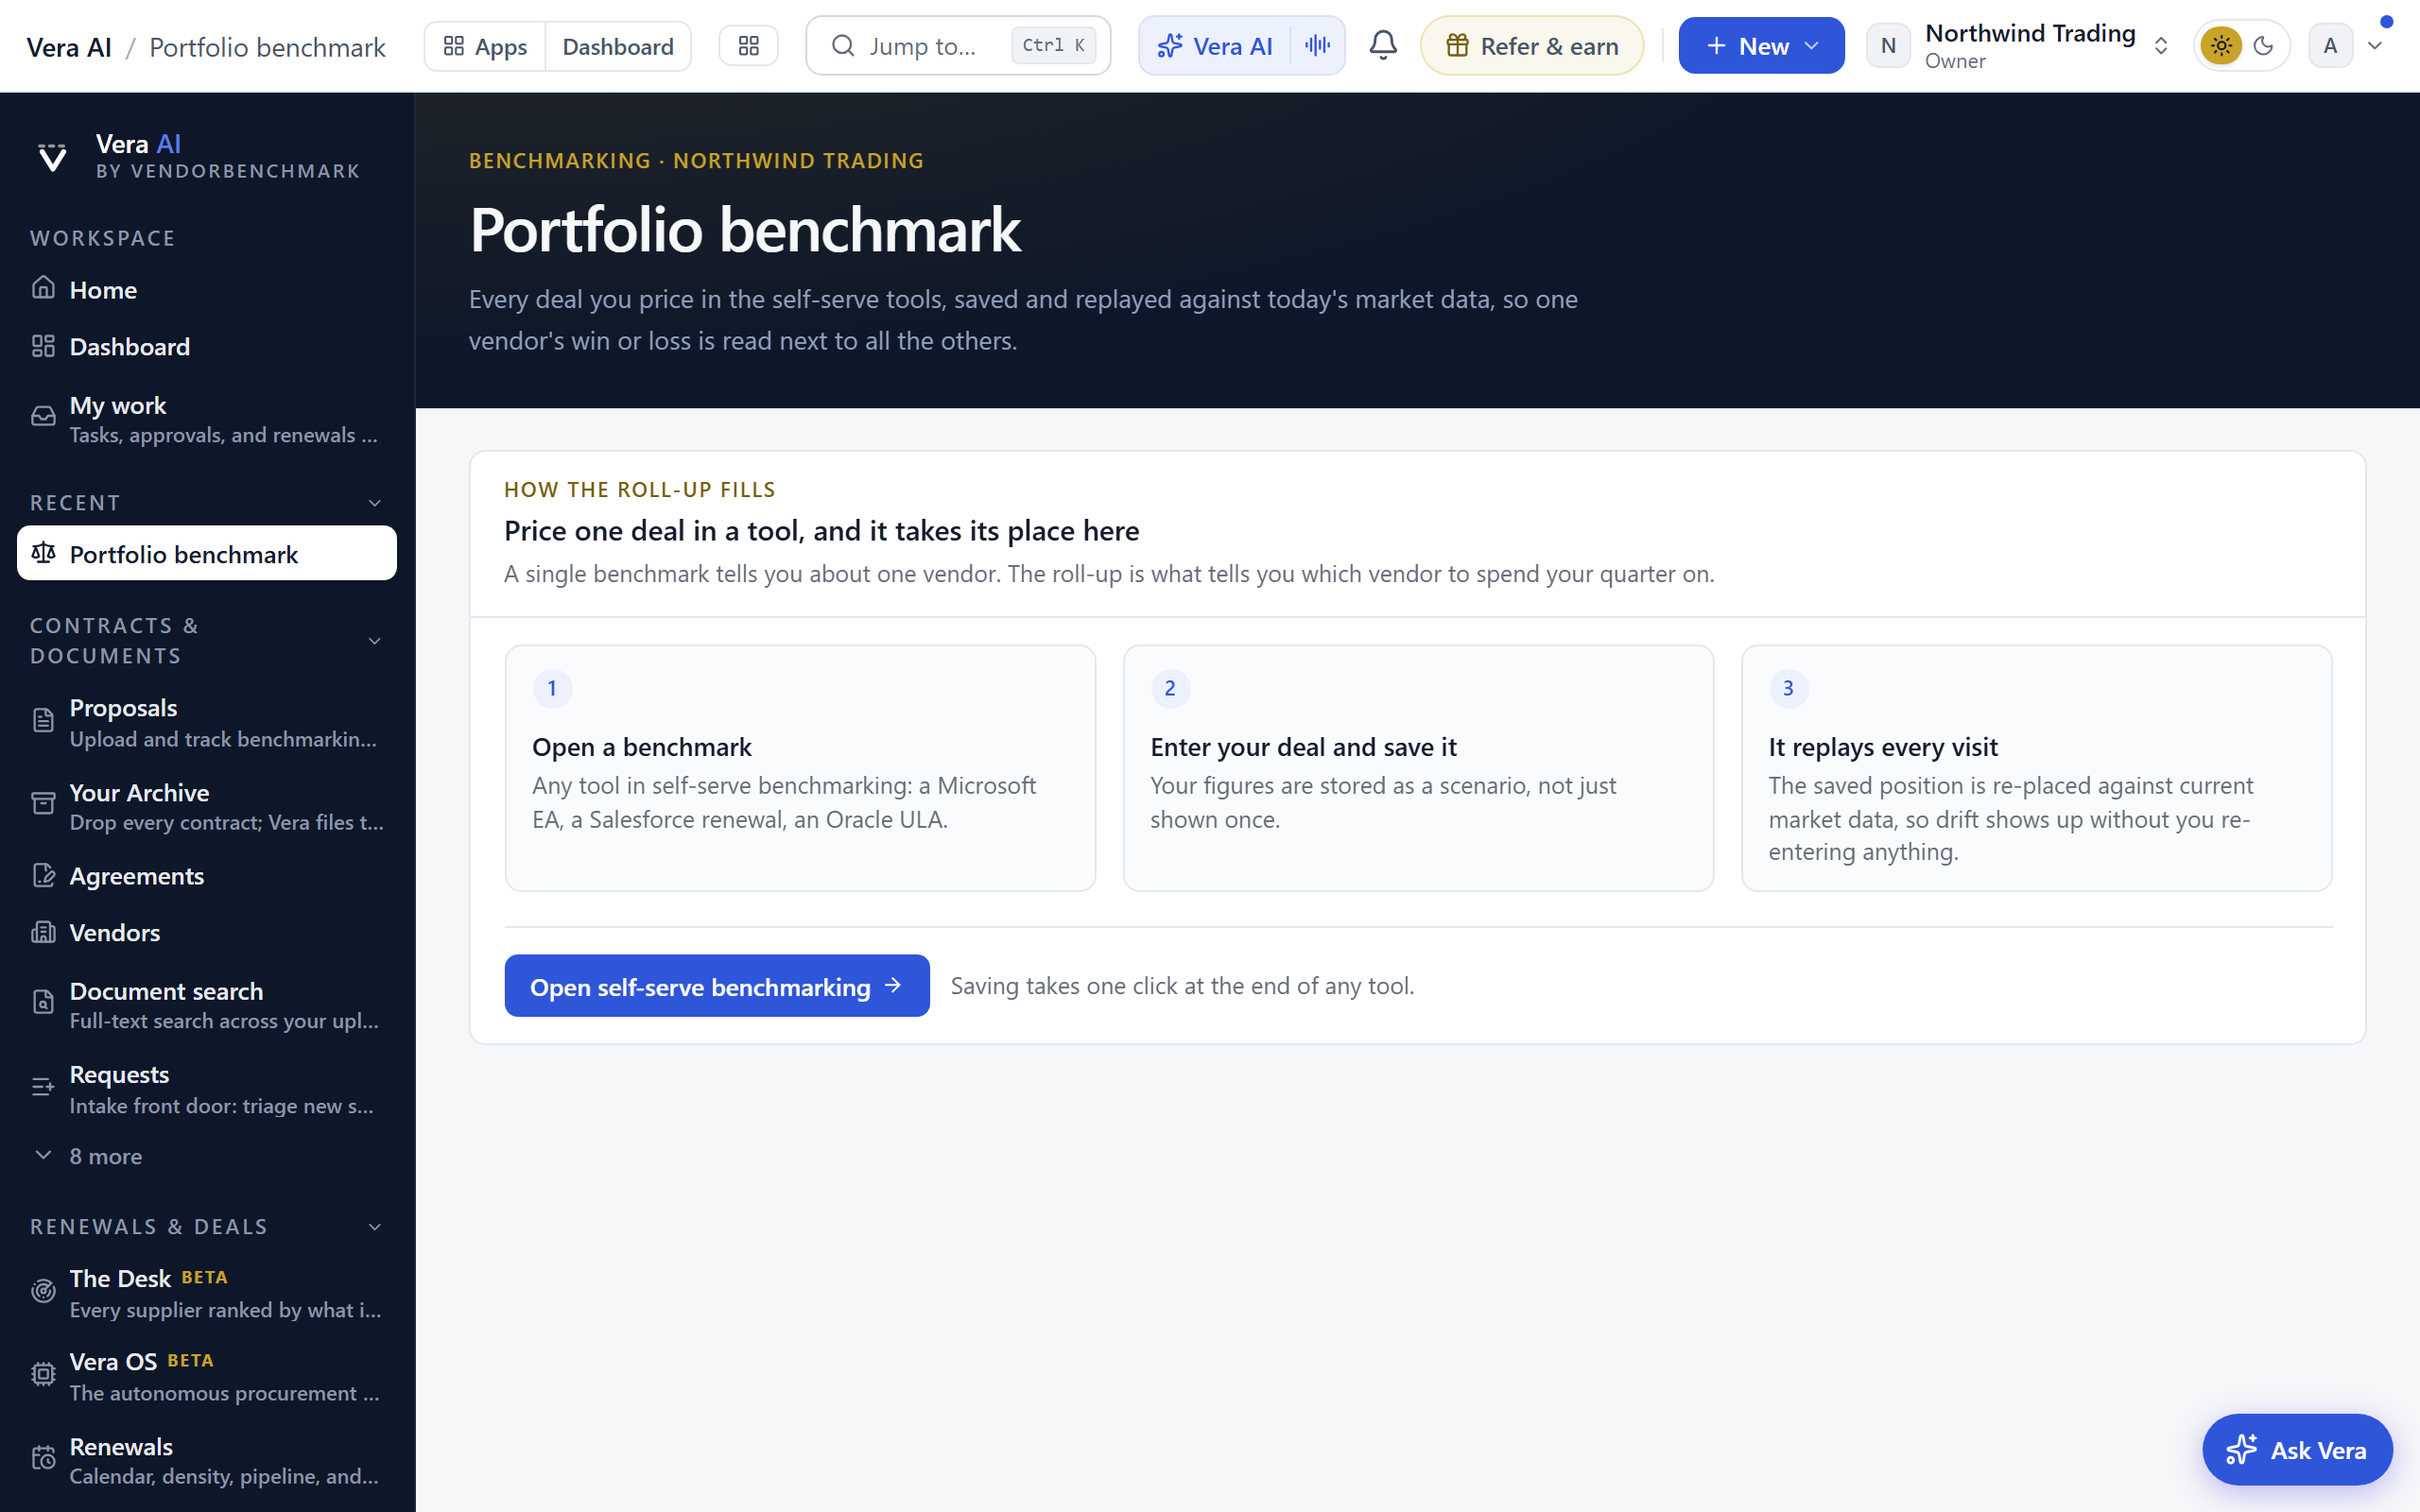
Your position sits in the masthead: positions placed, how many beat the market median, how many sit above it, and the total annual headroom between what you pay and the median.
On the screen
- Standing per vendor — each vendor's position against market pricing. The saved roll-up is built from the scenarios you save inside the vendor tools, so a vendor joins this view once you have saved a position for it. Uploading an agreement does not by itself place a vendor here.
- Savings prize — the estimated annual amount on the table if above-market deals moved to the median.
- The seeded start — with agreements on file but no saved scenario yet, the table is not empty. It opens seeded from your own records: a row for each of your ten largest agreements whose vendor has a self-serve tool, carrying the annual value you already store, each row marked From your {vendor} agreement with the renewal month where one is held.
- The one missing figure — each seeded row states the single number its tool still needs, and why: the list value where the vendor is ranked on discount off list, or the unit count (seats, users, cores) where it is ranked on net fee per unit. A row with no stored annual value asks for that instead.
- What is not seeded — agreements beyond the ten largest, and agreements whose vendor has no self-serve tool, are counted and named under the table rather than dropped in silence. Every vendor tool stays open from the benchmark library.
- Nothing runs until you press Run — seeded rows are a draft. They are editable and removable, and no row is placed, saved, or benchmarked until you press Run the benchmark. Removing them all says so and leaves your workspace untouched.
- What next — the roll-up ends with its next moves: rework the largest-headroom position in its vendor tool, start the negotiation, open the savings plan, copy the one line verdict, or take the numbers to Vera or a booked analyst.
How to use it
- On a fresh workspace, fill in the one missing figure on the rows you care about and press Run the benchmark for a quick placement of each.
- Open a vendor that looks above market to see the detail behind its standing.
- To keep a position in the roll-up rather than just placing it once, open that vendor's tool and save the scenario there.
- See ranked savings opportunities on the Opportunities lens of Portfolio.
Tips
- A run from the seeded table is a quick placement against reference data, not a saved position. Saving a scenario inside the vendor tool is what adds a lasting row to this roll-up.
- An Oracle Technology position is ranked on discount off list, and the fee a discount gap moves is a one-time license charge rather than a yearly one, so it contributes no annual headroom to the total above.
Related: Portfolio · Benchmark all my vendors
Benchmark all my vendors
A three page portfolio benchmark generated from every agreement you have uploaded: spend per vendor, market position where our reference data defends one, and an explicit insufficient-data note where it does not.
*In plain words: the Portfolio benchmark screen as a document you can forward.*
When to reach for this
- The estate read needs to leave the platform: a Word document for finance, not a screen share.
- You want the honest coverage map: page three names exactly which vendors cannot be benchmarked yet and the one step that fixes each.
On the screen
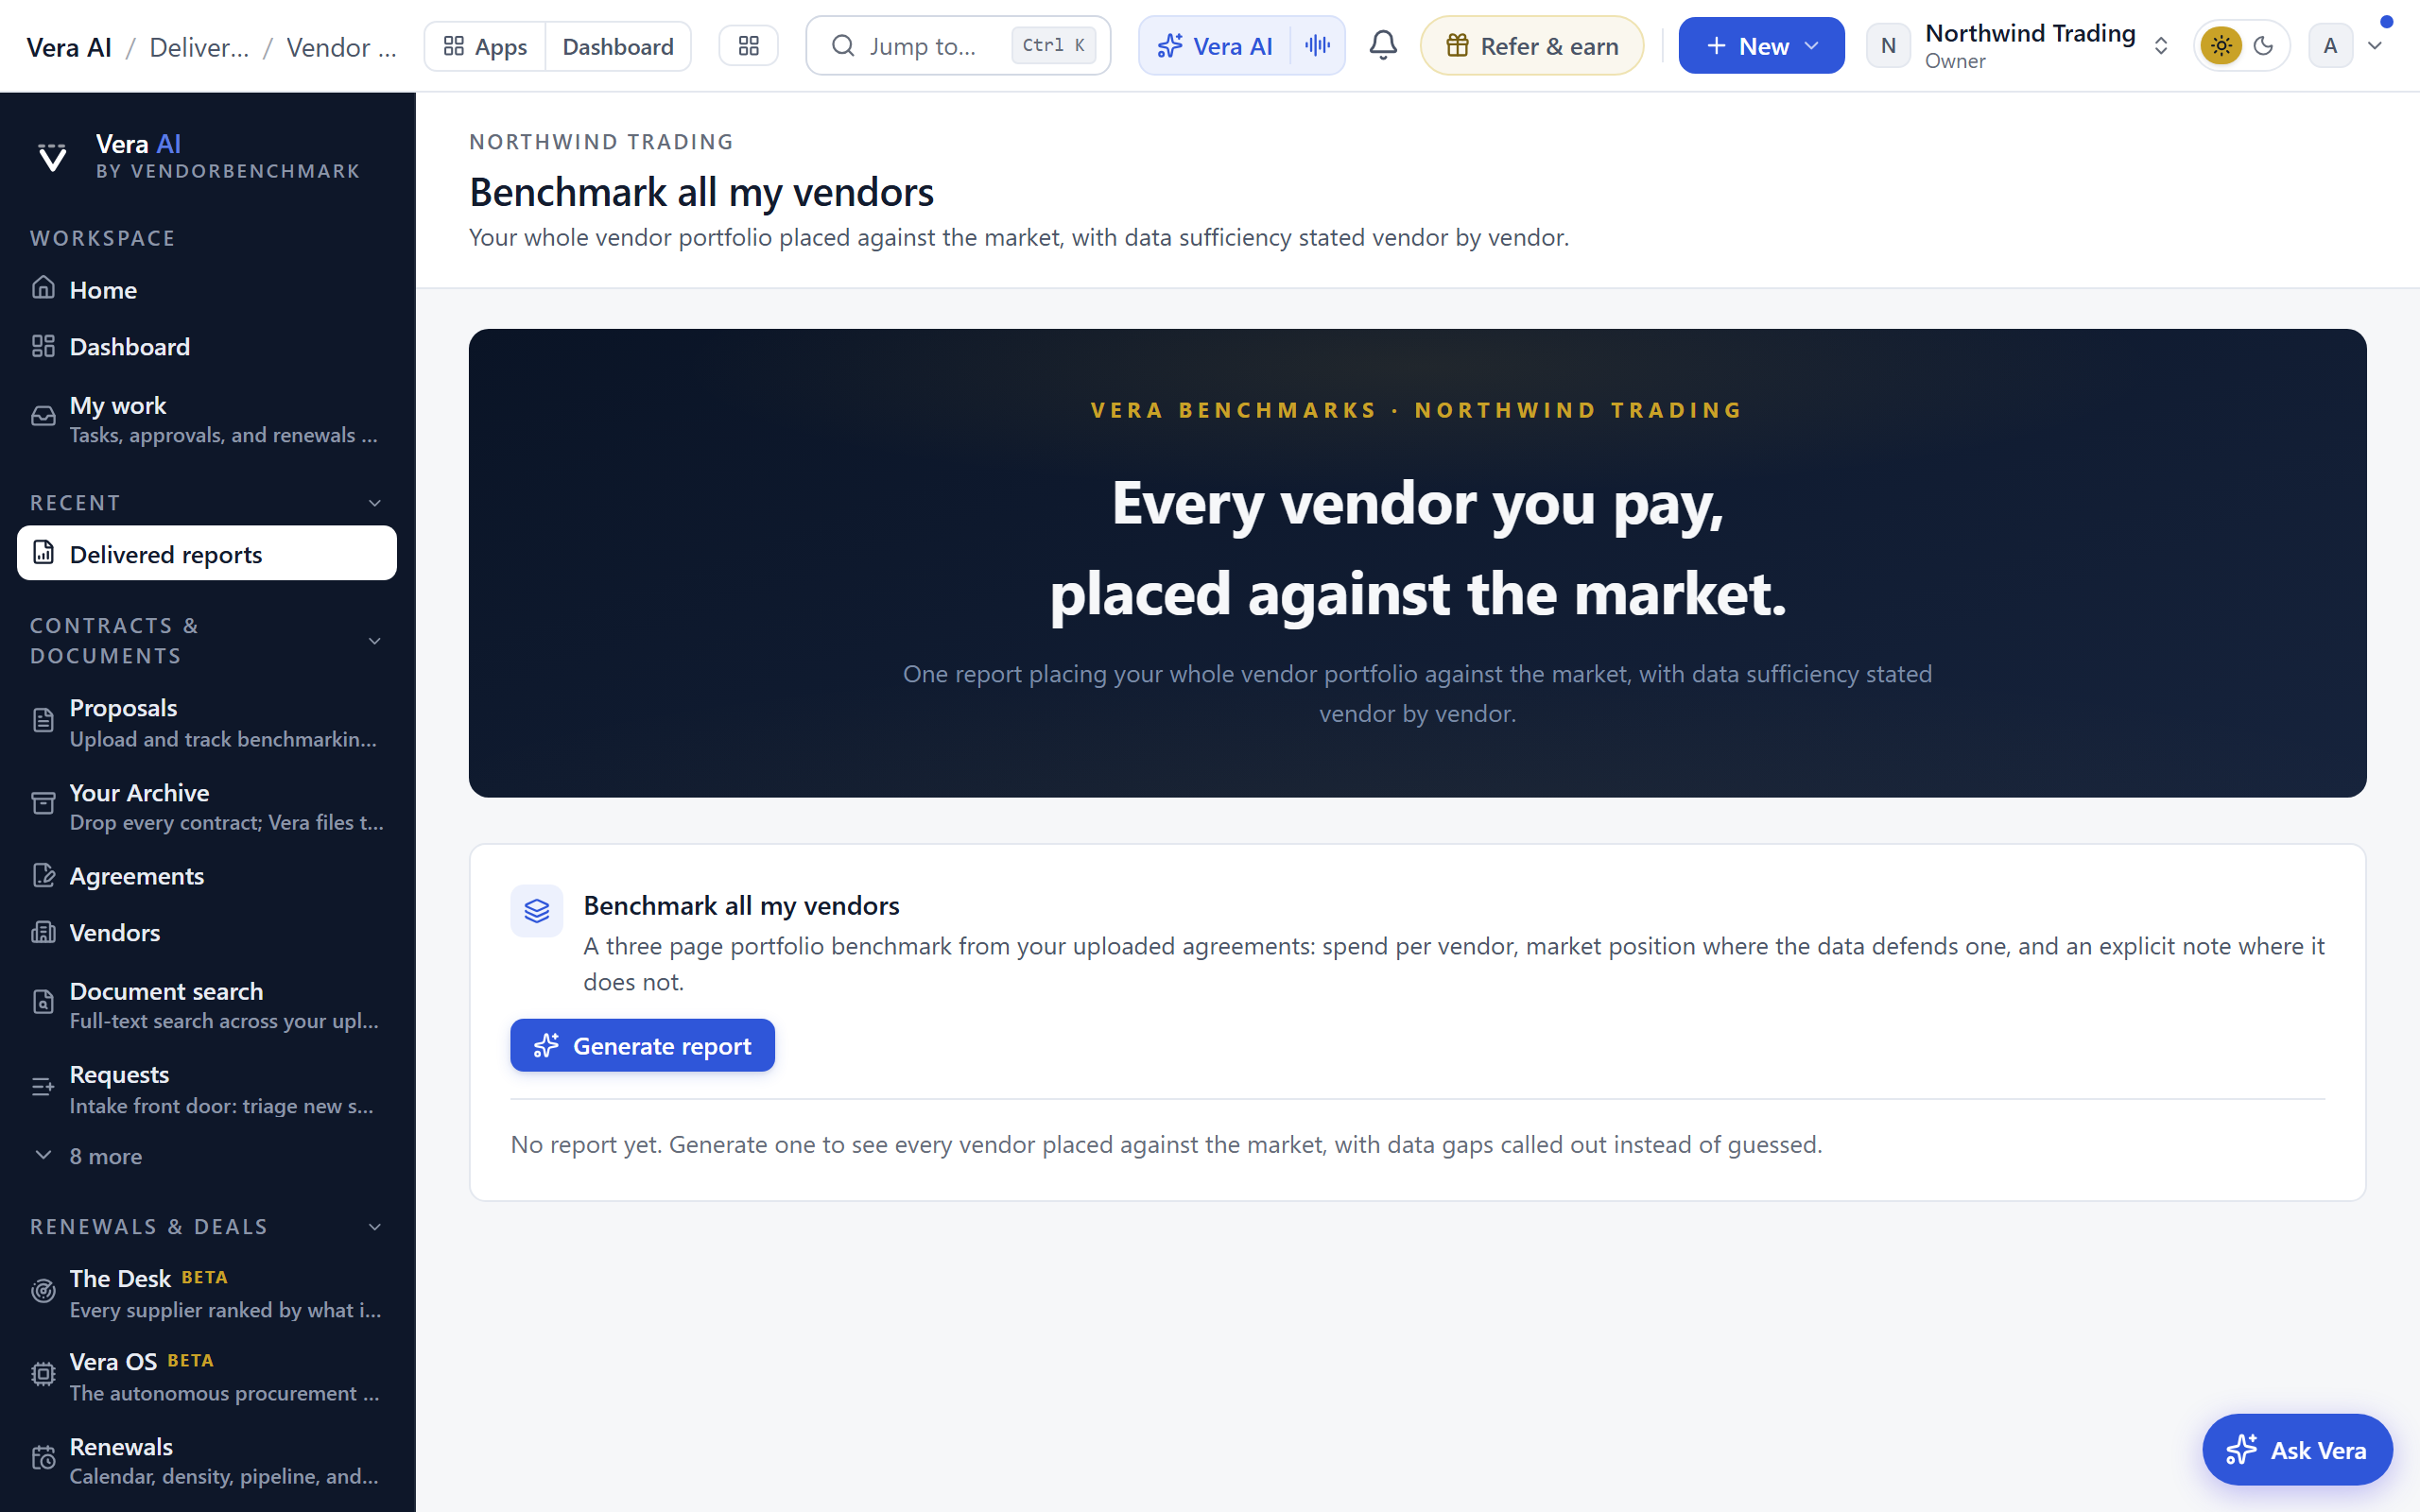
- Generate button — scans your agreements, places each vendor in its peer cohort, writes the report, and checks every figure against your stored data. Takes 1 to 3 minutes.
- Trust strip — like every AI-generated report, it opens with its grounding state ("Figures verified against your data", or a review notice when a figure needs one), the source count, the generation date, and feedback thumbs.
- Spend per vendor — page one: portfolio vitals and an overview of annual spend by vendor, largest first.
- Market position table — page two: each vendor's position and the basis for it, a delivered analyst score, a cohort percentile with a ± range, market reference data, or insufficient data.
- Data coverage — page three names the vendors we cannot benchmark yet and the one step that closes each gap. We never estimate a position without data.
- What next — the report ends with its next moves, built from its own totals: turn the positions into the savings plan, start a negotiation on the largest headroom vendor, copy the one line verdict, ask Vera which vendor to take to the table first, or book the analyst. The Send it on panel drafts the CFO, CIO, vendor, or colleague email from the report itself.
How to use it
- Generate or regenerate the report.
- Download as Word; the export matches the on-screen brief.
- Close a data gap by adding a list price or seat count in the vendor's benchmark tool, which moves it from reference to ranked.
Tips
- This report reads from agreements, not one-off instant checks. The more complete your Agreements list, the more of your stack it can place.
Related: Portfolio benchmark · Delivered reports
Delivered reports
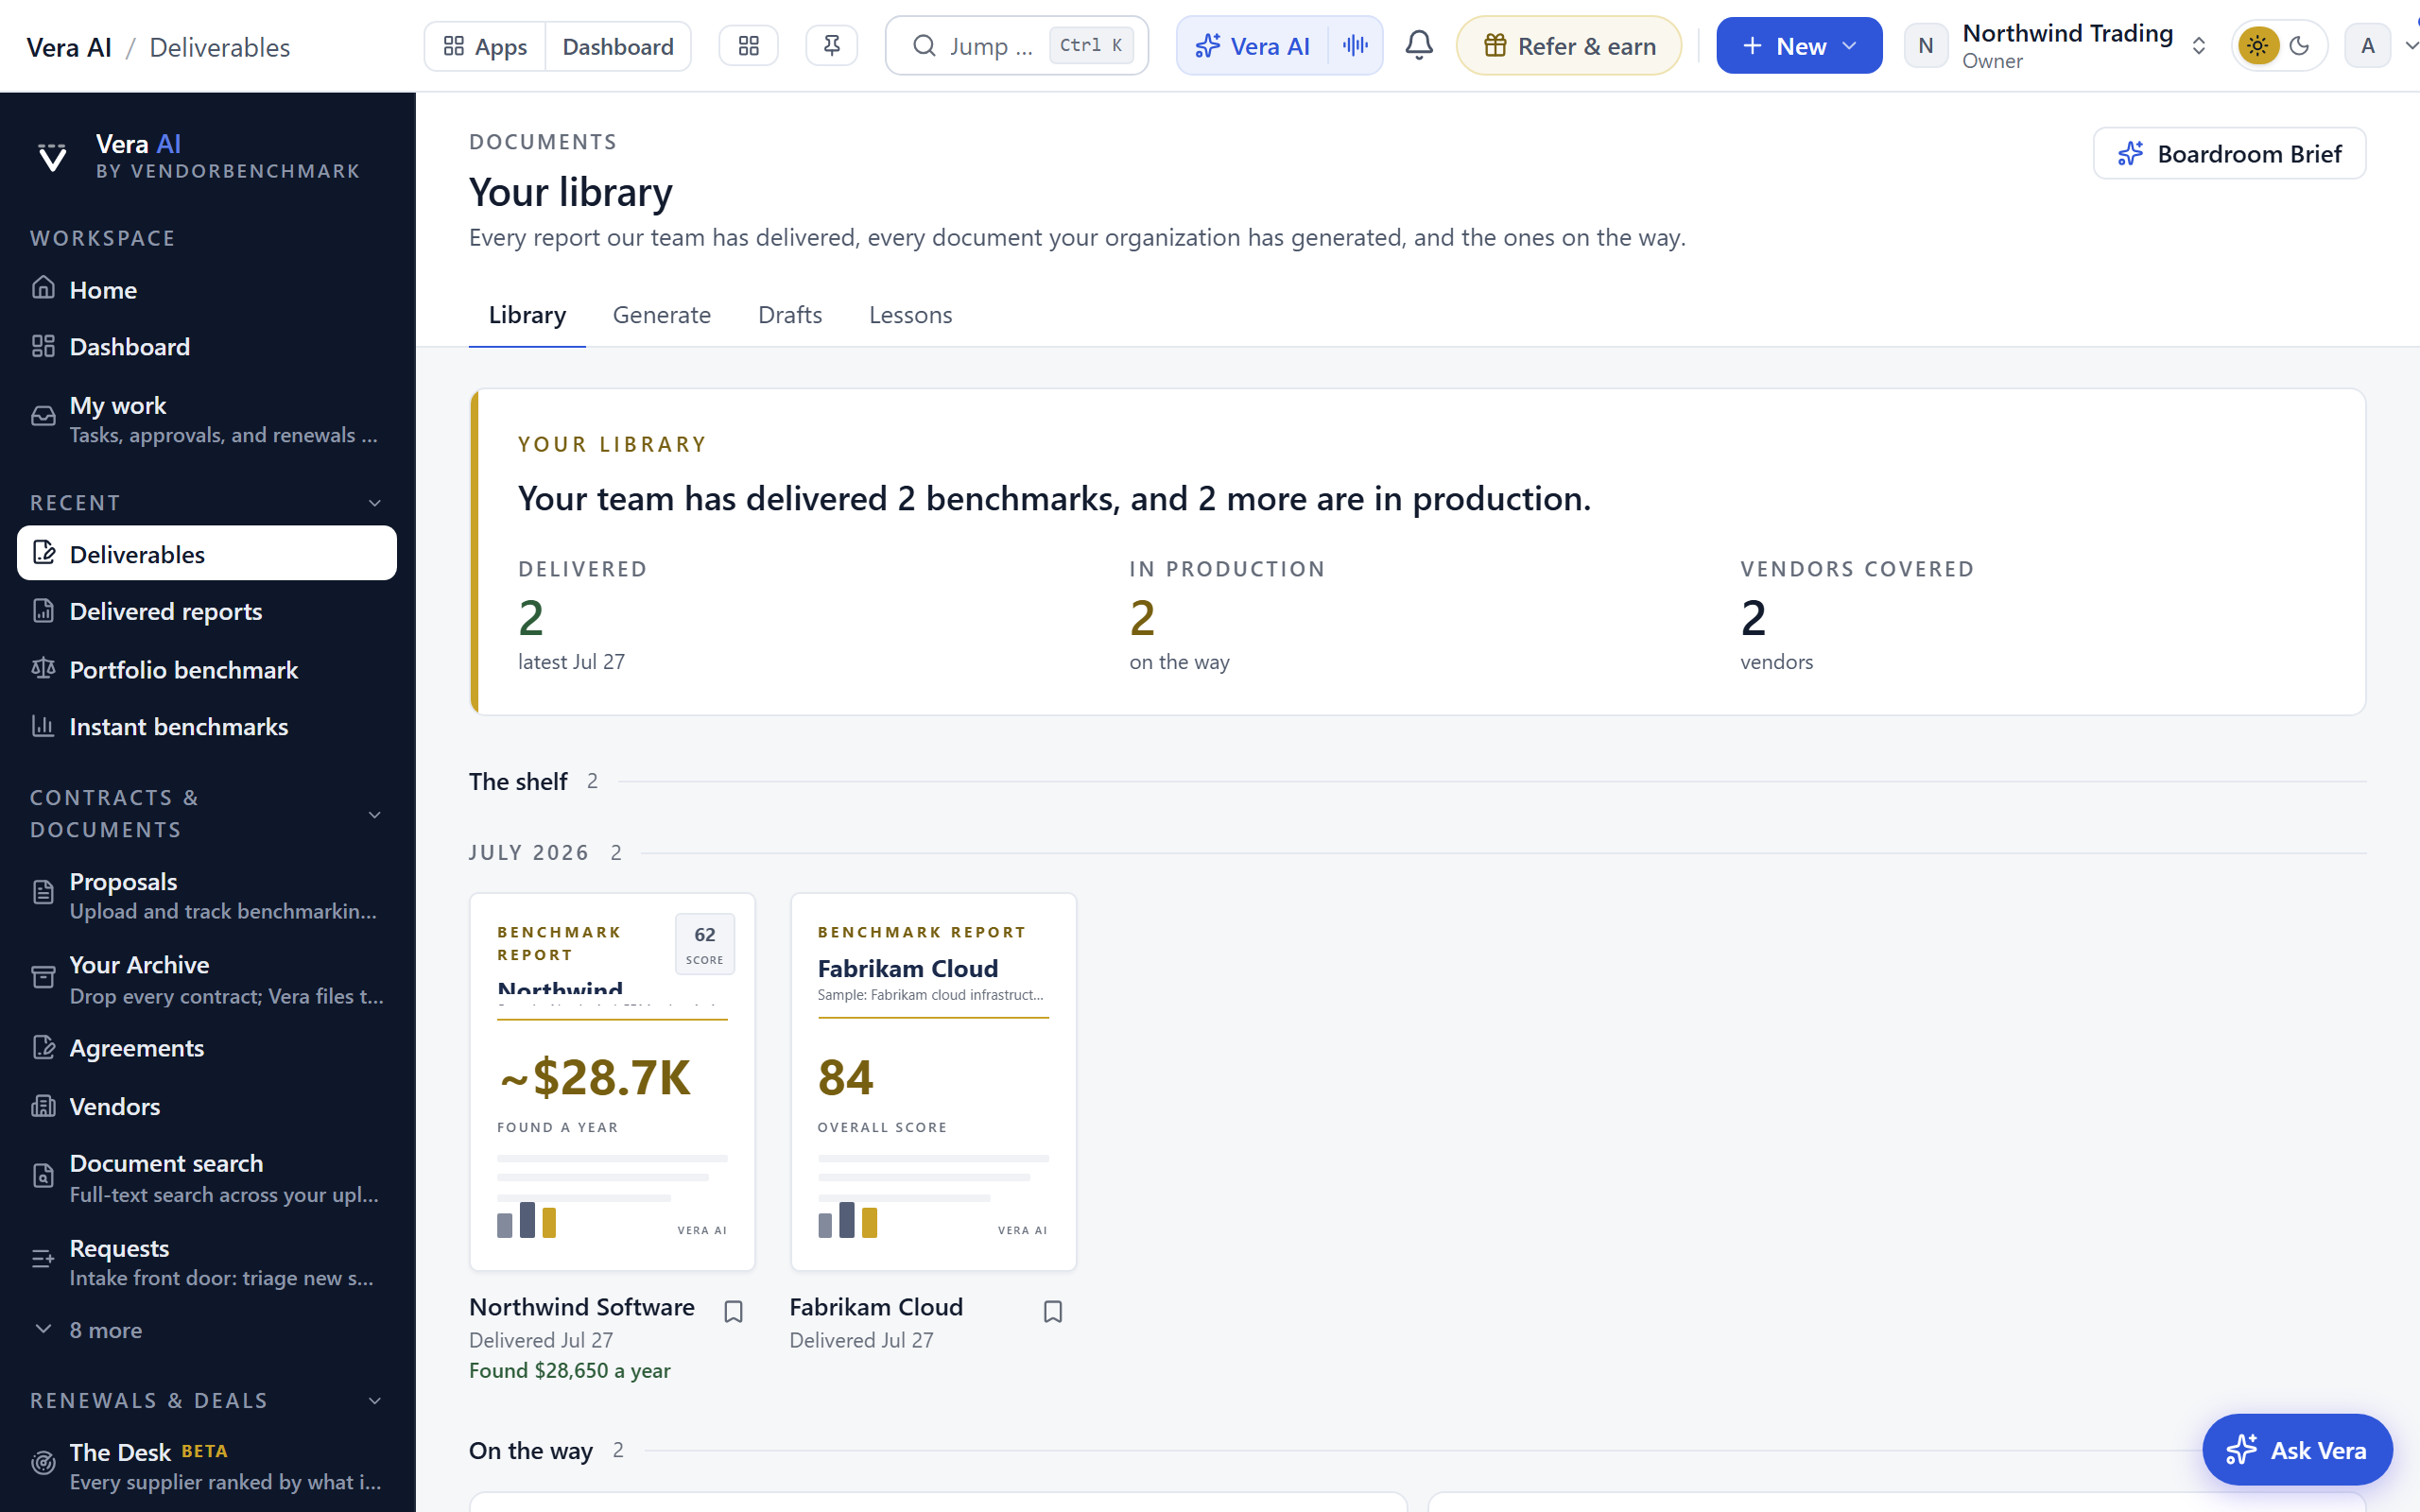
Benchmark reports our analysts delivered for your proposals, plus anything still in flight with its estimated delivery date. This page is also your documents library: everything the platform has ever written for your organization lives in the All documents section below the shelf. Report covers on the shelf lead with the annual value found; the overall score sits as a small corner mark. The whole library opens as its own window, landing on the Delivered to you folder its name promises, and the Library, Reports, Generate, Drafts, Lessons and Reading room tabs all move inside the same frame; Esc closes back to Home.
*In plain words: the reports the analysts wrote for you, and the shelf of everything else the platform has ever written.*
When to reach for this
- A proposal you uploaded reads Delivered and you want the finding.
- You are hunting for something the platform wrote weeks ago: a memo, a decode, a face-off.
- The renewal is near and the delivered report's levers need to become the ask list.
A worked example. The sample portfolio's delivered report on the Northwind CRM subscription shows the shape every report follows. The finding: the deal is above market, with $28,650 a year in reach. The evidence: the seat price at $571 against a market median of $504, worth $16,750 a year, and a 12 percent discount off list against a 22 percent median, worth $11,900. The structure: a 7 percent uplift cap against a 5 percent median means the premium widens every year it is left alone. The levers follow in order, priced, with the talking points scripted. Read your own reports the same way: finding, evidence, structure, then the play.
On the screen
- Report page — a metrics table with percentile bars, market low, median and high, an overall score, and the analyst summary. Reports generated from August 2026 lead with a paged executive brief: a vitals strip, the executive summary, a deal snapshot of your current position against the benchmark supported position, your terms against the market band with a standing verdict per metric, the headline metric drawn against its band, a savings bridge priced from the stored metrics, numbered negotiation levers with a sequencing note, and scripted talking points; earlier reports keep the layout they were delivered in. Long reports show a thin gold reading-progress line at the top of the window, a reading-time estimate in the byline, numbered figures with their sources, and a Top button once you scroll.
- Open the case — on a delivered report, "The case file" navy band on the proposal's Report tab opens the benchmark as a full screen case: numbered executive brief documents in a grouped left rail, paged with the arrow keys, with a read meter and Esc to close. Six documents: the cover, the source proposal record, the analyst brief, a metrics atlas with the market ranges and the verdict table, an ask sheet priced from the stored figures, and a What now sheet with a drafted CFO brief, a vendor safe meeting request, chat ready copies, and the PDF. Drafts open in your own inbox, nothing sends from a case, and every figure is read from the report itself.
- In-flight benchmarks — proposals still in review, with an estimated delivery date.
- All documents — every brief, memo, and report your organization has generated. The library opens as a shelf of document covers, hued by type, with the vendor, title, and date on each spine; a Covers | Table toggle switches to the dense table (sortable, searchable, pageable, CSV export) and remembers your choice. The library also lists your saved drafts, contract decodes, and quote face-offs alongside the AI deliverables. A cover or row opens the document itself, with the owning record one click away in the table's Context column.
- Origin filter — beside the type filter, narrow the library by where a document came from: All origins, AI report, Tool run, or Draft.
- Boardroom Brief, presented — after writing a Boardroom Brief from this page, Present beside its download actions opens it full screen as a four movement show: the posture, renewals and risk, savings and leverage, then the asks, with the brief's KPI figures on the stage ticker and a printable leave-behind of the screens you walked.
- Boardroom Brief, as a case file — once a brief is written, Open as a case file in the dialog and preview footers expands it into the same full screen case reader: a cover sheet with the headline numbers and the bottom line, one exhibit per section of the brief, and a What now sheet carrying the same Word and PowerPoint downloads, a team circulation draft, and the desks to open next.
- Word downloads — rows whose type supports it show a clickable Word link in the Formats column, so you can export straight from the list. Most document types export to Word, including vendor dossiers, QBR prep packs, deal handoff memos, audit exposure reports, clause coverage reports, consolidation memos, position trajectory reports, diligence reports, SOW rate reviews, vendor relationship analyses, and saved tool analyses.
- Put an analyst on it — in the report's moves, one press sends the paper to a VendorBenchmark analyst through the same request the record page's button makes, and says the day the benchmark is due. A paper already with the analysts says so instead of queuing twice. Say it to the specialist by name and the same move is pressed for you.
- The specialist reads the report with you — a specialist on the line sees the delivered report whenever this tab is open: the executive summary, where you stand, every term against its range, the asks, the clause risks, the recommendations and the bottom line. Say walk me through it and the answer comes from the report itself; say open my Salesforce report at the recommendations and the tab lands on that section with a ring on it (the clause risks, where you stand, the levers and the executive summary answer the same way). Once you have kept a target on the agreement (below), the report carries Your target and the specialist says where the deal stands against it.
How to use it
- Open a report and walk the metrics.
- Download the report as a PDF.
- When you are hunting for something the platform wrote earlier, sort or search All documents instead of revisiting the record that produced it; the row opens the document itself, and the Word link in its Formats column downloads it directly.
- Bookmark a report for later, and find it again in Saved.
Tips
- A delivered report comes from uploading a proposal for expert review, not from an instant check. Start one on the Analyst Benchmark screen.
If something looks wrong
- The shelf is empty: no proposal has reached Delivered yet. The in-flight strip shows what is coming and when; an instant benchmark fills the gap today.
- A report you expect is missing from All documents: check the Origin filter first; it may be narrowed to one origin.
Related: Analyst Benchmark · Saved
Send it on: the follow up email, drafted
*In plain words: the follow-up email, already written, for whichever reader you have in mind.*
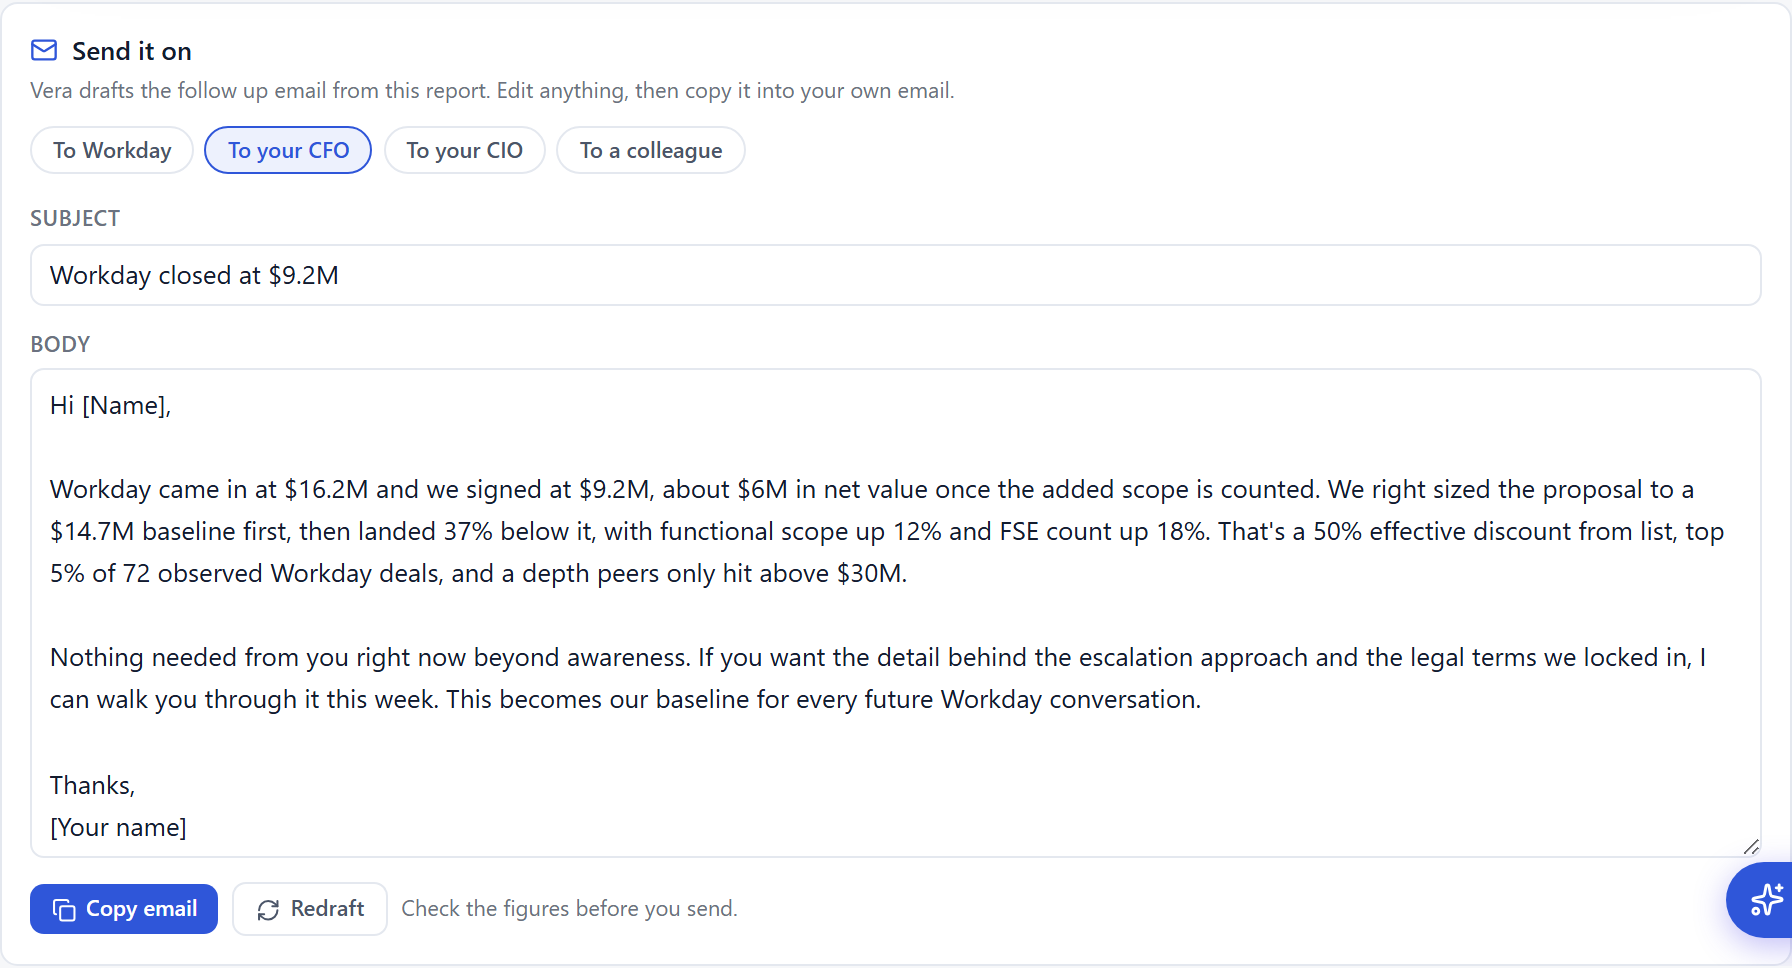
A report is rarely the last step; someone has to act on it. The Send it on panel at the foot of every report drafts that email for you. Pick the reader and Vera writes a short, friendly note built only from the report above it, never from figures the report does not carry. Nothing sends from the platform: you copy the finished email and paste it into your own mail client.
On the screen
- Reader chips — To the vendor (named when the report knows the vendor), To your CFO, To your CIO, To a colleague. Each reader gets its own draft: the vendor note is friendly but firm and careful about what it reveals, the CFO note leads with the money, the CIO note frames the platform decision, the colleague note is a quick heads up.
- Subject and body — both fully editable before you copy. Drafts are short on purpose, two paragraphs at most, and sign off with a [Your name] placeholder.
- Copy email — copies the subject line and body together, ready to paste into Outlook or Gmail.
- Redraft — writes a fresh draft for the selected reader if the first one misses the mark.
- Confidentiality check — vendor drafts pass the same scan as negotiation language; if a draft carries an internal figure or a name it should not, a warning lists exactly what to remove.
- On the dashboard — the desk rail carries a Send it on card listing your newest documents; Draft email opens the same panel without leaving the dashboard.
- In theatre mode — presenting a brief adds an envelope button to the stage controls; it opens the drafting drawer over the show, built from the document on stage, so the follow up is written before the room empties.
How to use it
- Open any report and scroll past the document to the Send it on panel.
- Press the chip for the reader you have in mind and give Vera a few seconds.
- Edit the subject or body until it sounds like you.
- Press Copy email, open a new message in your mail client, and paste.
Tips
- Drafts only state figures that appear in the report itself. If a number is missing, the email speaks in direction instead; add specifics in your edit if you want them.
- Switching chips keeps each reader's draft, edits included, until you leave the page.
Related: Delivered reports · Renewals
Reporting studio
56 standardized reports on your own contracts and spend, plus custom commissioned ones. Every run is written from your stored agreements only, addressed to the reader you choose (CIO, CFO, or procurement), at the length you choose (2 to 5 pages), and figure checked against your data after writing. Where the data cannot support a number, the report says not on file instead of estimating.
*In plain words: pick a report, pick the reader, and a grounded executive brief writes itself from your own records.*
When to reach for this
- Leadership asked for something in writing and the deck-building afternoon is not available.
- The recurring documents (the spend review, the renewal pipeline, the concentration read) should come from live data, not from last quarter's copy.
- You need a document the catalog does not have: the commission desk takes a title and one sentence.
On the screen
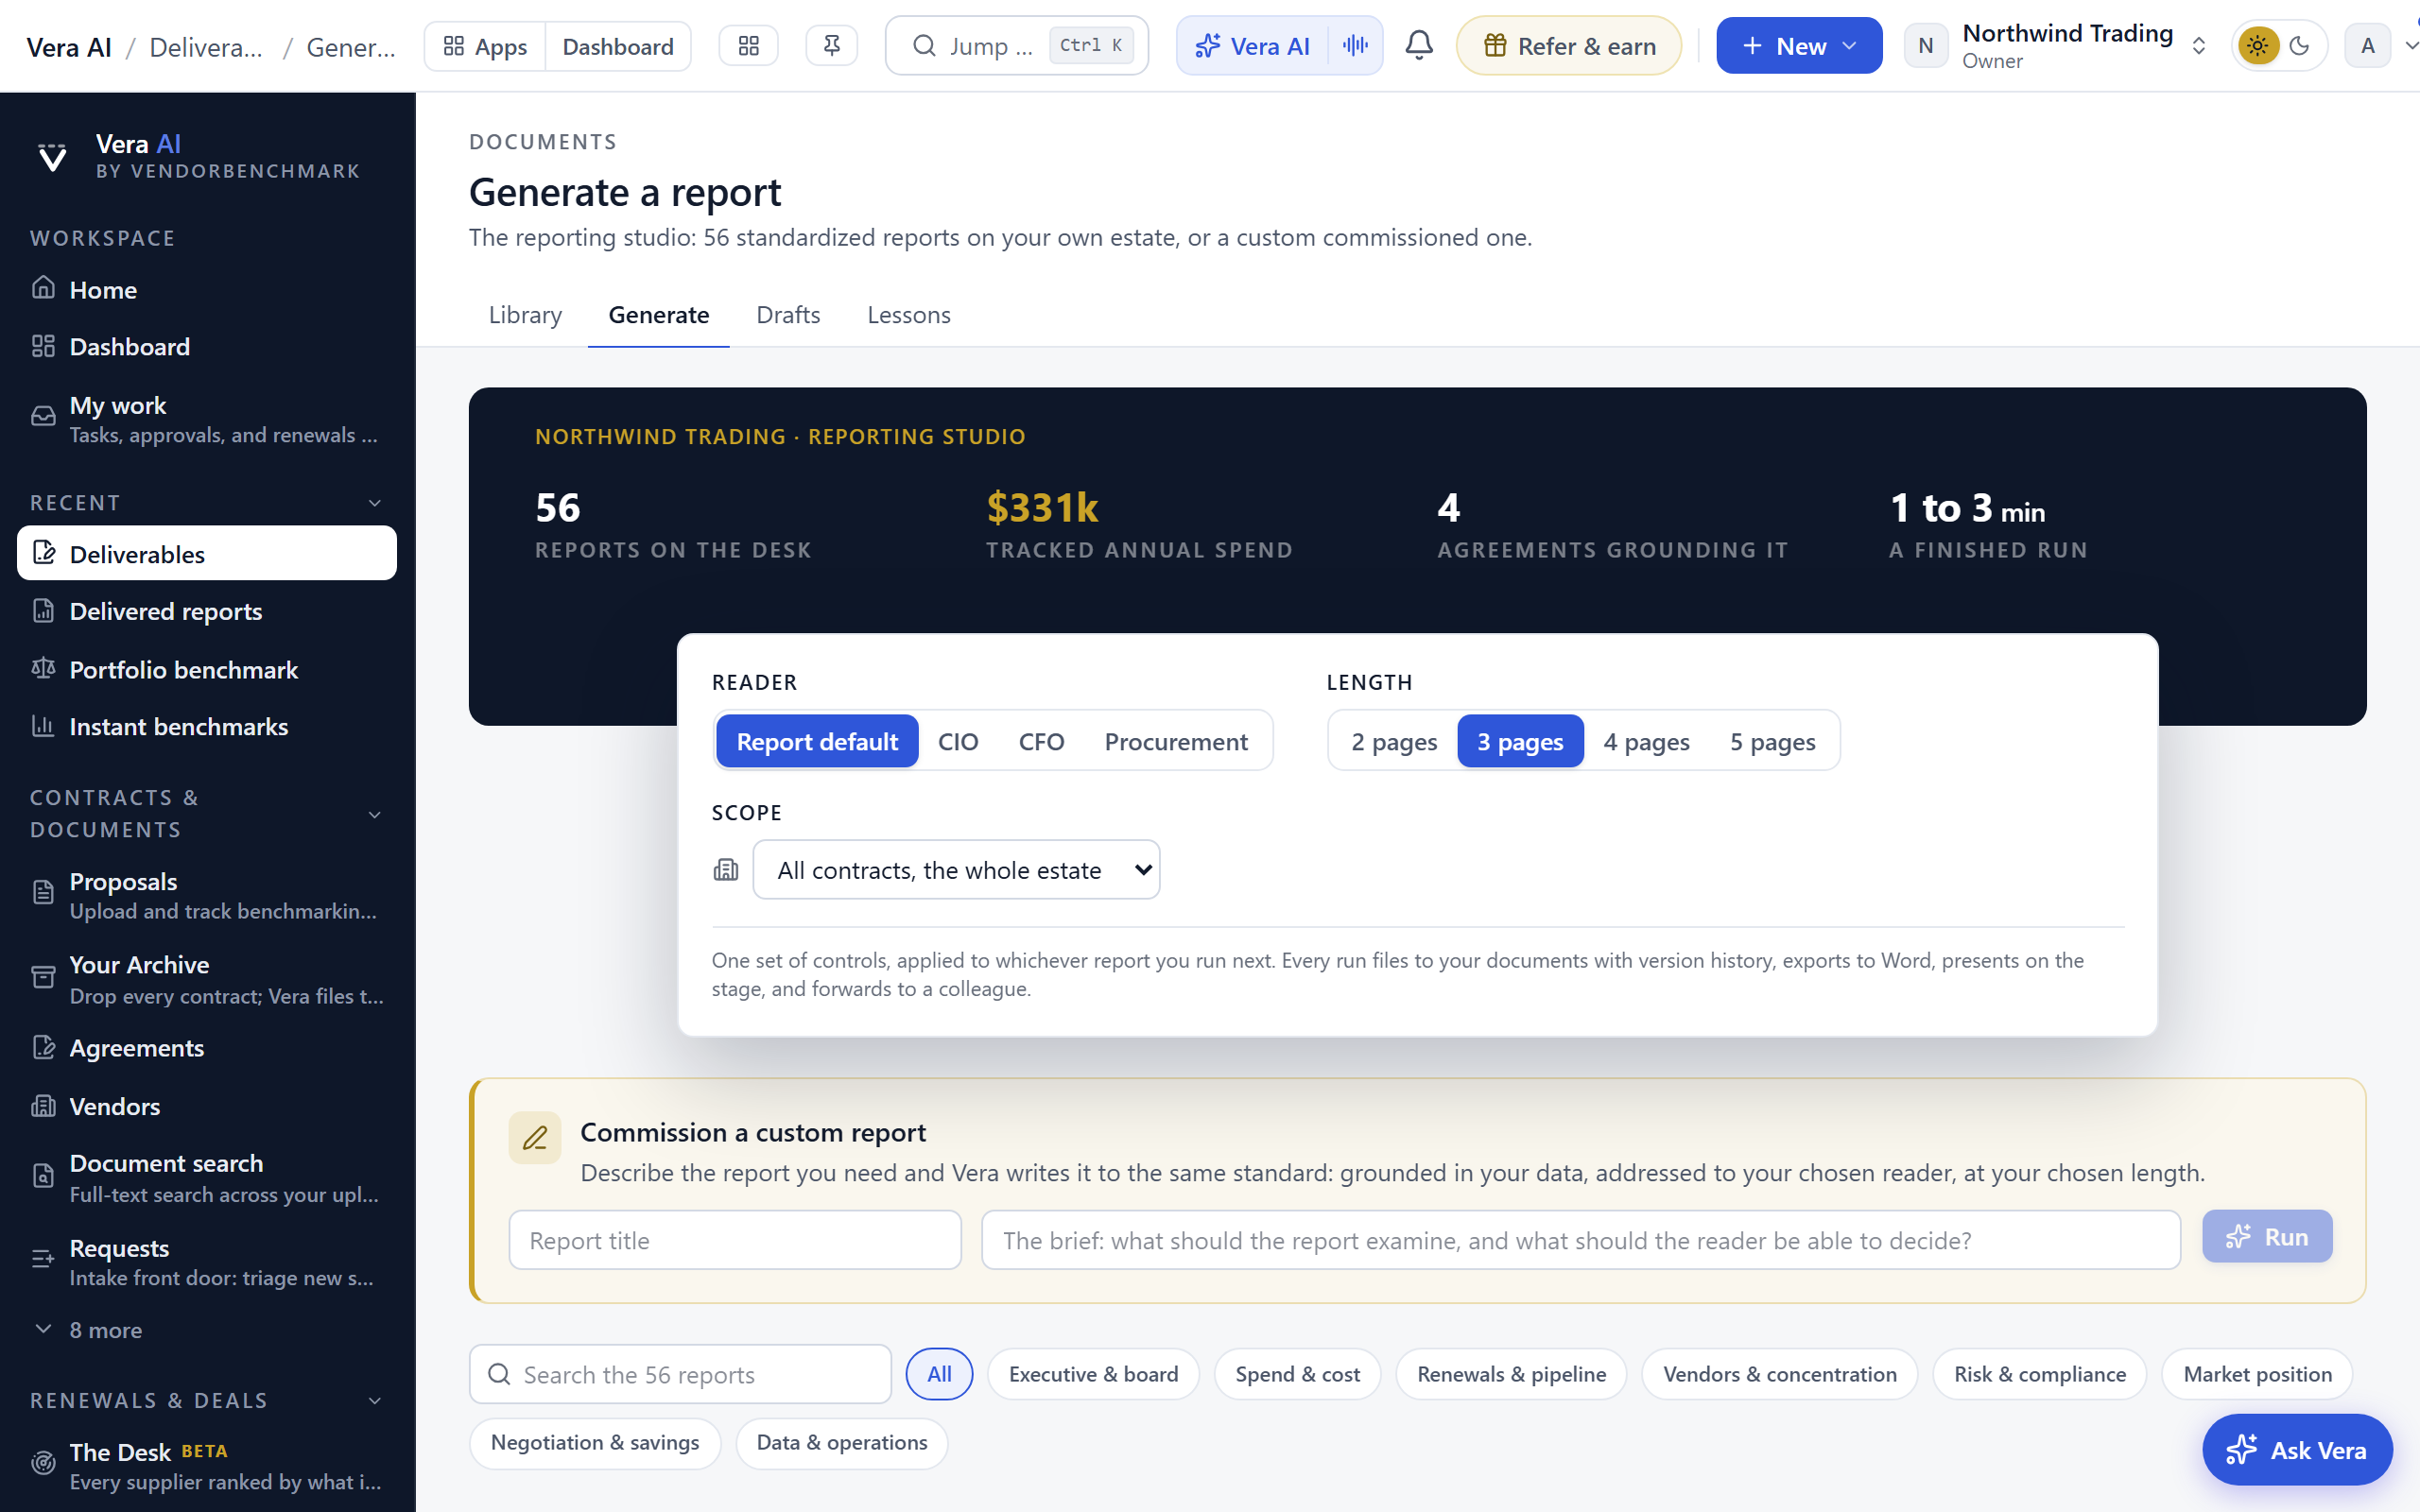
- The commissioning stage — the dark masthead opens with your estate's own numbers: tracked annual spend, the agreements grounding every figure, and the 56 reports on the desk.
- Run controls — Reader, Length, and Scope float beneath the stage as one instrument, applied to whichever report you run next. Report default lets each report address its natural reader; the scope select narrows any run to one vendor.
- The catalog — 56 reports across eight groups, each card a miniature executive brief cover: executive and board, spend and cost, renewals and pipeline, vendors and concentration, risk and compliance, market position, negotiation and savings, and data and operations. Search filters by title and topic; the category chips narrow by group; the whole card is the Run button.
- The Writing Room — running a report raises a full screen stage where the document writes itself in front of you: the masthead and gold rule land first, the vitals arrive with the fact pack, the prose writes line by line, and the fact check sweeps the figures in gold, beside a five stage checklist, a live progress rail, and an analyst ticker narrating the work.
- Commission a custom report — a title and a one sentence brief produce a report the catalog does not have, to the same grounded standard.
- Recent runs — your latest reports as chips, one press back to any of them.
- The run page — the finished document with its Word export, print to PDF, Reader and Length controls for regenerating, and version history.
- Present — runs the report full screen on the shared stage as a working session: the executive summary opens, the vitals get their own screen, each section walks as its own act, and the close carries the recommendations and the bottom line. The stage's envelope button drafts the follow up email without leaving the show.
- Forward — emails the report to a colleague with your own note and a 30 day read only link. No account needed on their side.
- Send it on — beneath every finished report, the follow up email drafter: to the vendor, your CFO, your CIO, or a colleague (see Send it on).
How to use it
- Pick the reader and the length in the run controls; leave Reader on Report default to let each report address its natural audience.
- To report on one vendor, choose it in the Scope control. Reports marked Runs on one vendor require it.
- Press Run on any catalog card. Generation takes 1 to 3 minutes and lands you on the finished report.
- On the run page, export to Word, print to PDF, or change the reader or length and press Regenerate.
- Press Present to walk the report on the stage, or Forward to email it to a colleague as a 30 day read only link.
- For something the catalog does not have, give the commission desk a title and a brief and press Run.
Tips
- The same report reads genuinely differently per reader: the CFO version leads every section with the number, the CIO version reads the estate as platform strategy, the procurement version is an ordered work list.
- Every run files into All documents on Delivered reports with version history, so a monthly rerun never overwrites last month's edition.
- A report is only as complete as the record: the Data gaps report in the catalog tells you exactly which missing values and dates to fix first.
Related: Delivered reports · Benchmark all my vendors · Analyst Benchmark
Vendor Intelligence
Your vendor register joined to the evidence that argues with a vendor: the documented curve each deal is placed against, the research briefs written for that vendor, the counterparty grade, the renewal runway, and the daily policy sweep. Six rooms in one window, and picking a vendor once follows it through all of them.
*In plain words: everything you know about a vendor and everything the market knows, on one screen, in the order the money says.*
When to reach for this
- Before you plan a quarter: the board tells you which vendor is worth working first, and why.
- Before a renewal call: the dossier holds the placement, the papers and the signals for that one vendor.
- When you want to know what you are missing rather than what you have: Coverage is the room for that.
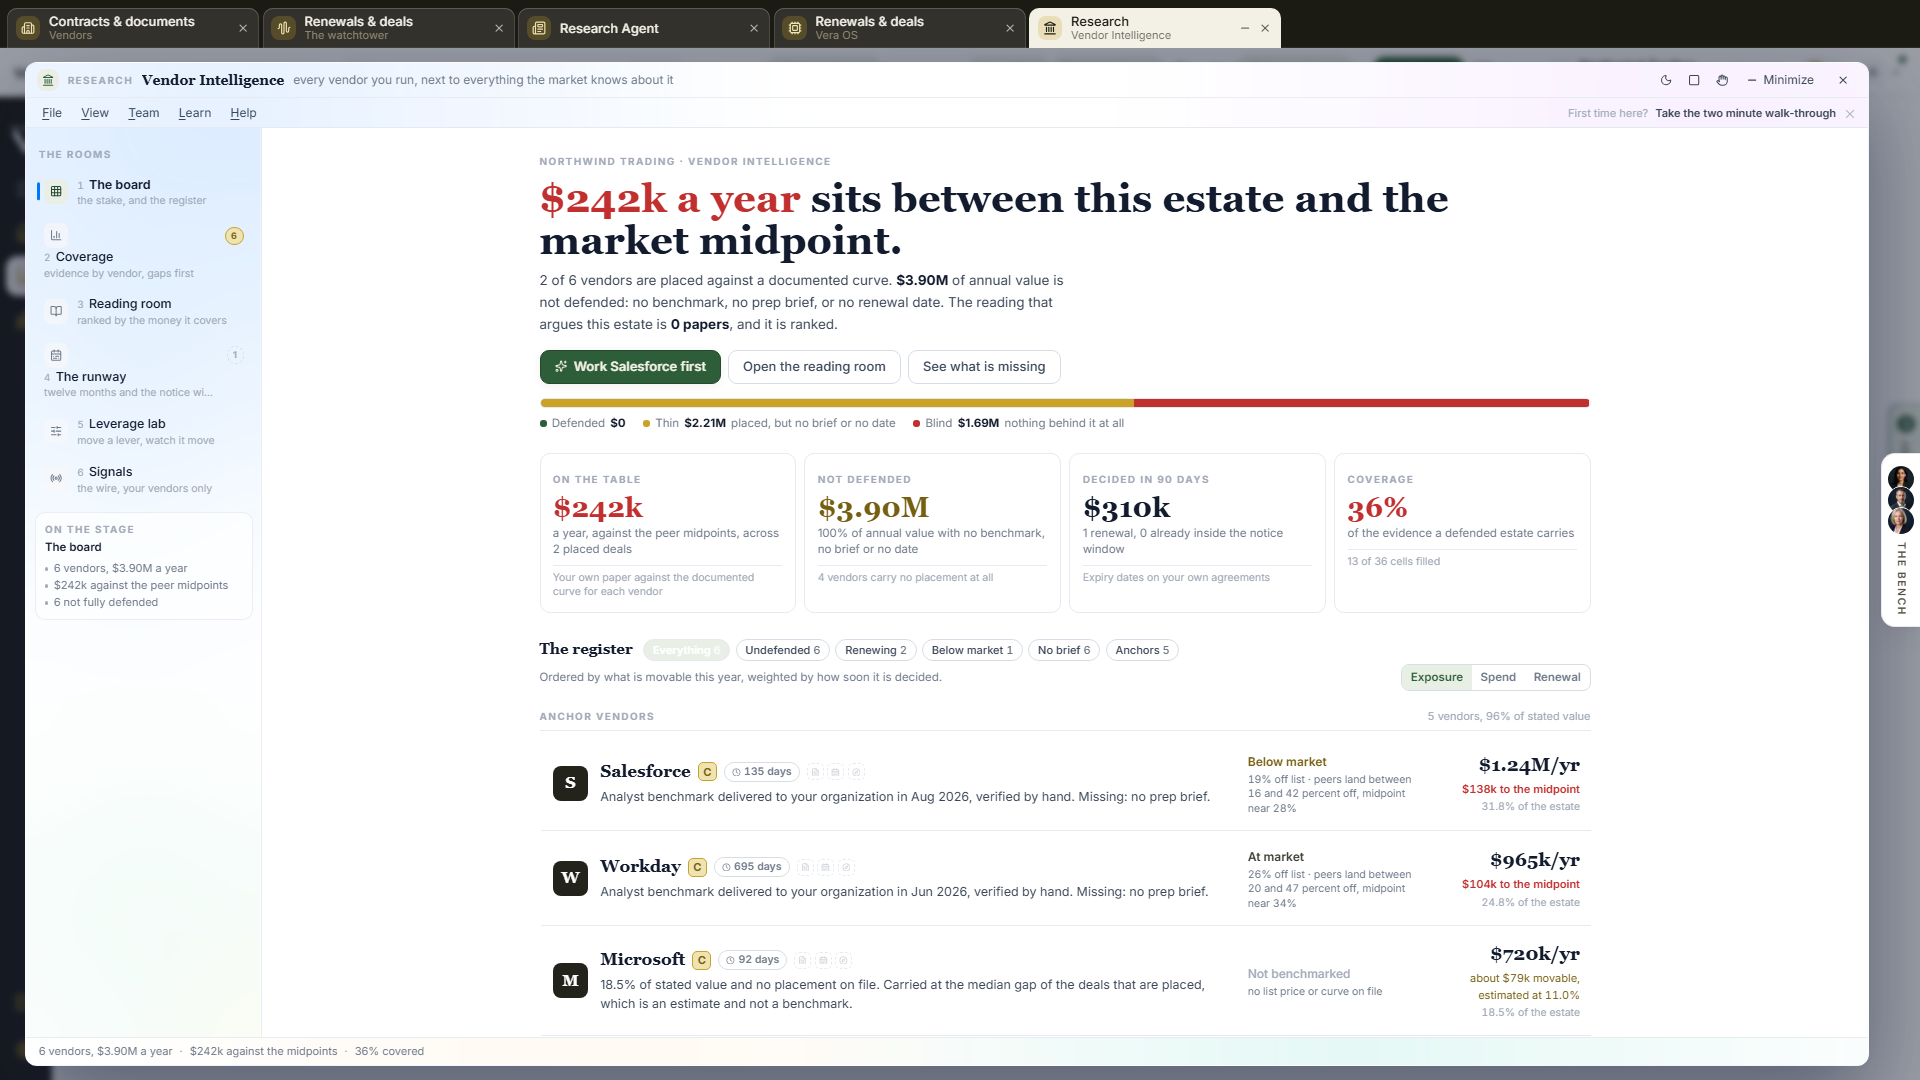
The stake, before the table. The page opens with what sits between this estate and the market midpoints, then how much annual value is not defended at all: no benchmark, no prep brief, or no renewal date. A bar under it splits the estate three ways, defended, thin and blind, so the shape is readable before you scroll.
On the screen
- The board (key 1) — the stake, four figures, where the money concentrates, and the register. Every row answers the three questions: what you are offered, what comparable buyers land, and where the deal ranks. Rows are sized by consequence, so an anchor vendor never renders like a tail one.
- Coverage (key 2) — every vendor against six evidence columns. Gaps render as gaps on purpose, and the thinnest column and thinnest row are named underneath.
- Reading room (key 3) — the research briefs matched to your vendors, ranked by the money each covers and how soon that money is decided. Reading top to bottom is the same as working the estate in the right order.
- The runway (key 4) — twelve months out, every tracked renewal pinned, the notice window shaded before each one. Anything with no date is listed separately as an alarm that cannot ring.
- Leverage lab (key 5) — move one lever, how far toward the peer midpoint the deal lands, and watch the year and the term move. Arithmetic on the volume already on your paper, so the same inputs always draw the same result.
- Signals (key 6) — the wire and the policy sweep filtered to the vendors you actually run, each with the line saying what it changes at your table.
- The dossier — pick any row and the right pane holds that vendor: the three questions, the record, the shelf, the signals. It follows you between rooms.
- Lenses — Undefended, Renewing, Below market, No brief, Anchors. One press and the register and the coverage table both follow.
How to use it
- Read the headline, then press the button naming the vendor to work first. The register is ordered by what is movable this year, weighted by how soon it is decided.
- Press 2 for Coverage and find the row with the fewest cells filled. That is usually one decision, not a project.
- Press 3 and read the top two papers. The figure beside each one is what that vendor is worth against the peer midpoint over a year.
- Press 4 and set a renewal date on anything listed as untracked.
- Press 5 with a vendor selected to price what closing its gap is worth before you open the conversation.
Tips
- A vendor with no placement is carried at the median gap of the deals that are placed, and the page says so wherever it shows one. It is an estimate to rank by, never a benchmark to quote.
- Esc closes the window and returns you to Home. The light or dark switch is in the title bar.
Related: Vendor scorecards · Research · Portfolio benchmark · Vendors
Vendor scorecards
Every calibrated vendor graded as a counterparty: the renewal corridor behind our benchmarks turned into an A-to-F grade, plus how verified buyers rate the vendor's renewal fairness, audit conduct, and flexibility. The book opens as its own window, every per-vendor scorecard stays inside it, and Esc closes back to Home.
*In plain words: what this vendor is like to renew with, graded, before you find out the hard way.*
When to reach for this
- Before the first call with a vendor you have never negotiated: the grade and the buyer ratings set your expectations.
- When shortlisting: two similar products with different renewal conduct are not similar purchases.
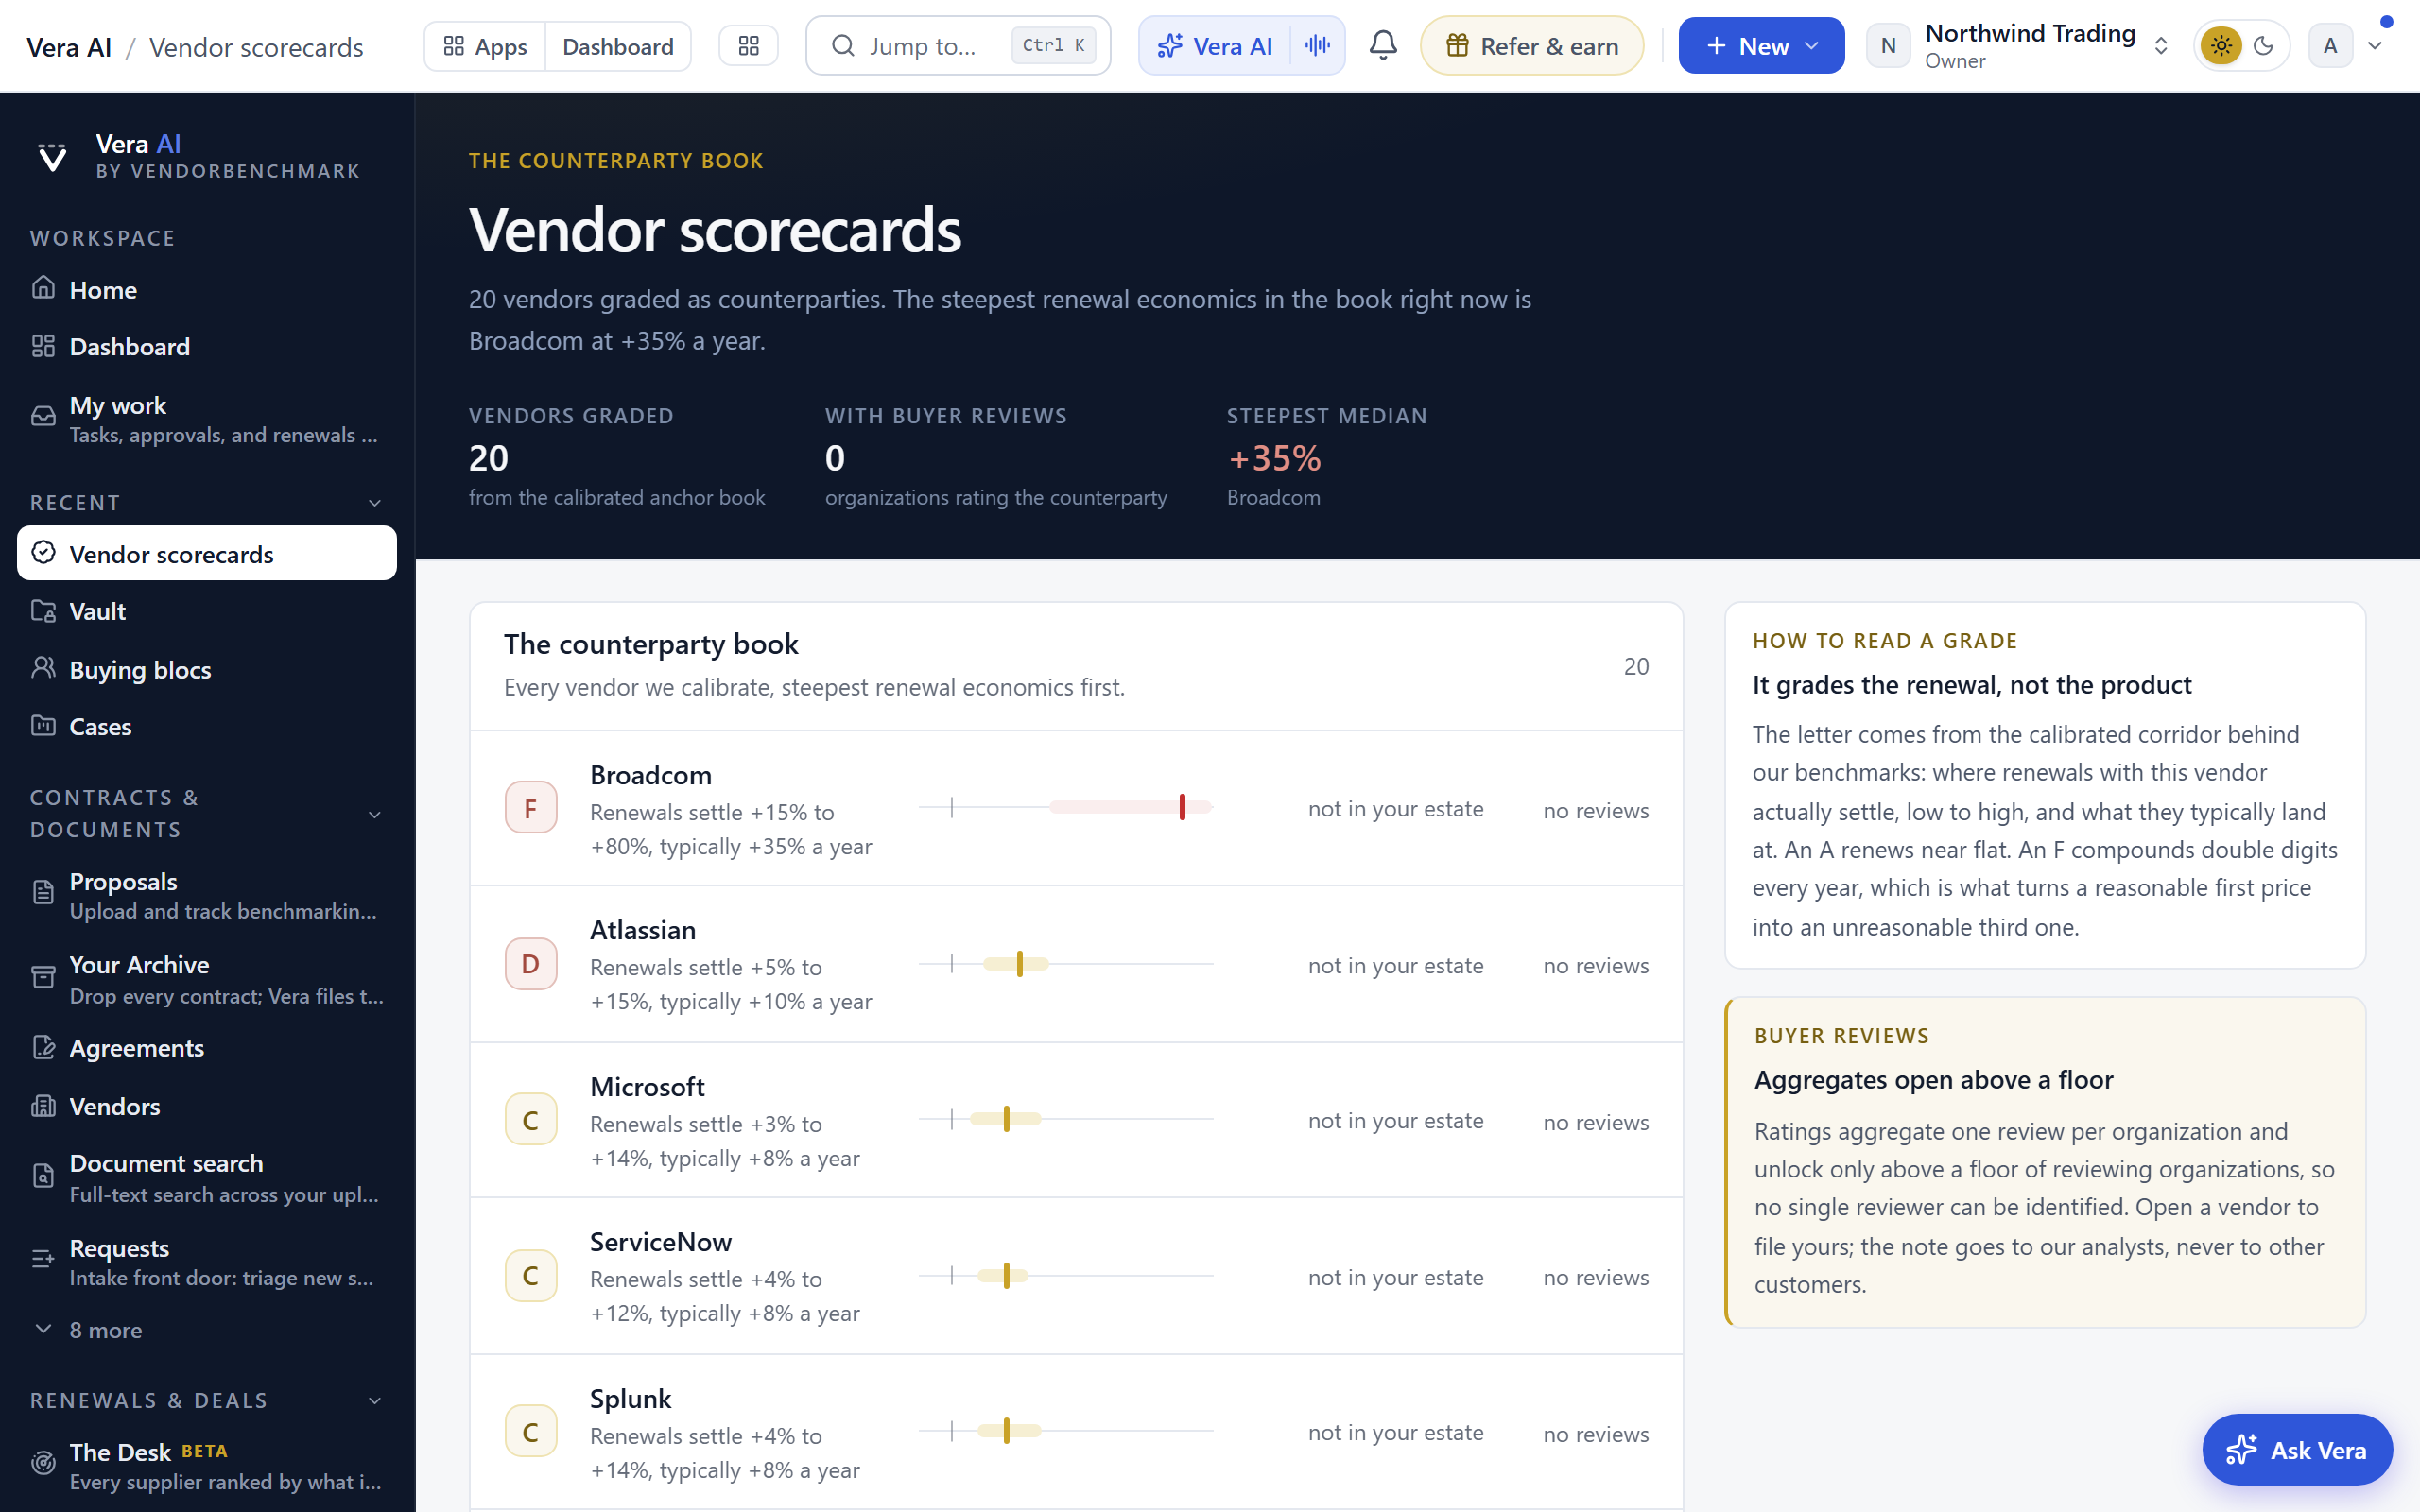
Read against your own estate. The page opens with how many of the graded counterparties you actually hold, what you pay them a year, and what renewing them at their own calibrated medians would add. That last figure, your annual value times the median uplift, is stated per vendor and as a total, and the vendors you hold are listed first in that order. Every corridor is drawn on one shared axis with the median marked and a hairline at a flat renewal, so two vendors compare by eye rather than by reading two sentences.
On the screen
- The grade — renewal economics from the calibrated corridor, not a popularity score.
- Buyer ratings — one review per organization, shown only as floored aggregates.
- Public page — each vendor has a public scorecard the whole market can cite.
- Put the grade to work — the vendor page's rail routes onward: run an instant benchmark against the corridor, build the renewal plan, open the vendor room, or start the negotiation.
- Your own dossier — the grade is the market's read on a publisher; Your <vendor> dossier at the top of the page opens your own record for it, with your paper, your renewal, and your position.
How to use it
- Rate a vendor you hold paper with.
- Open the public page for a vendor you are renewing.
Research
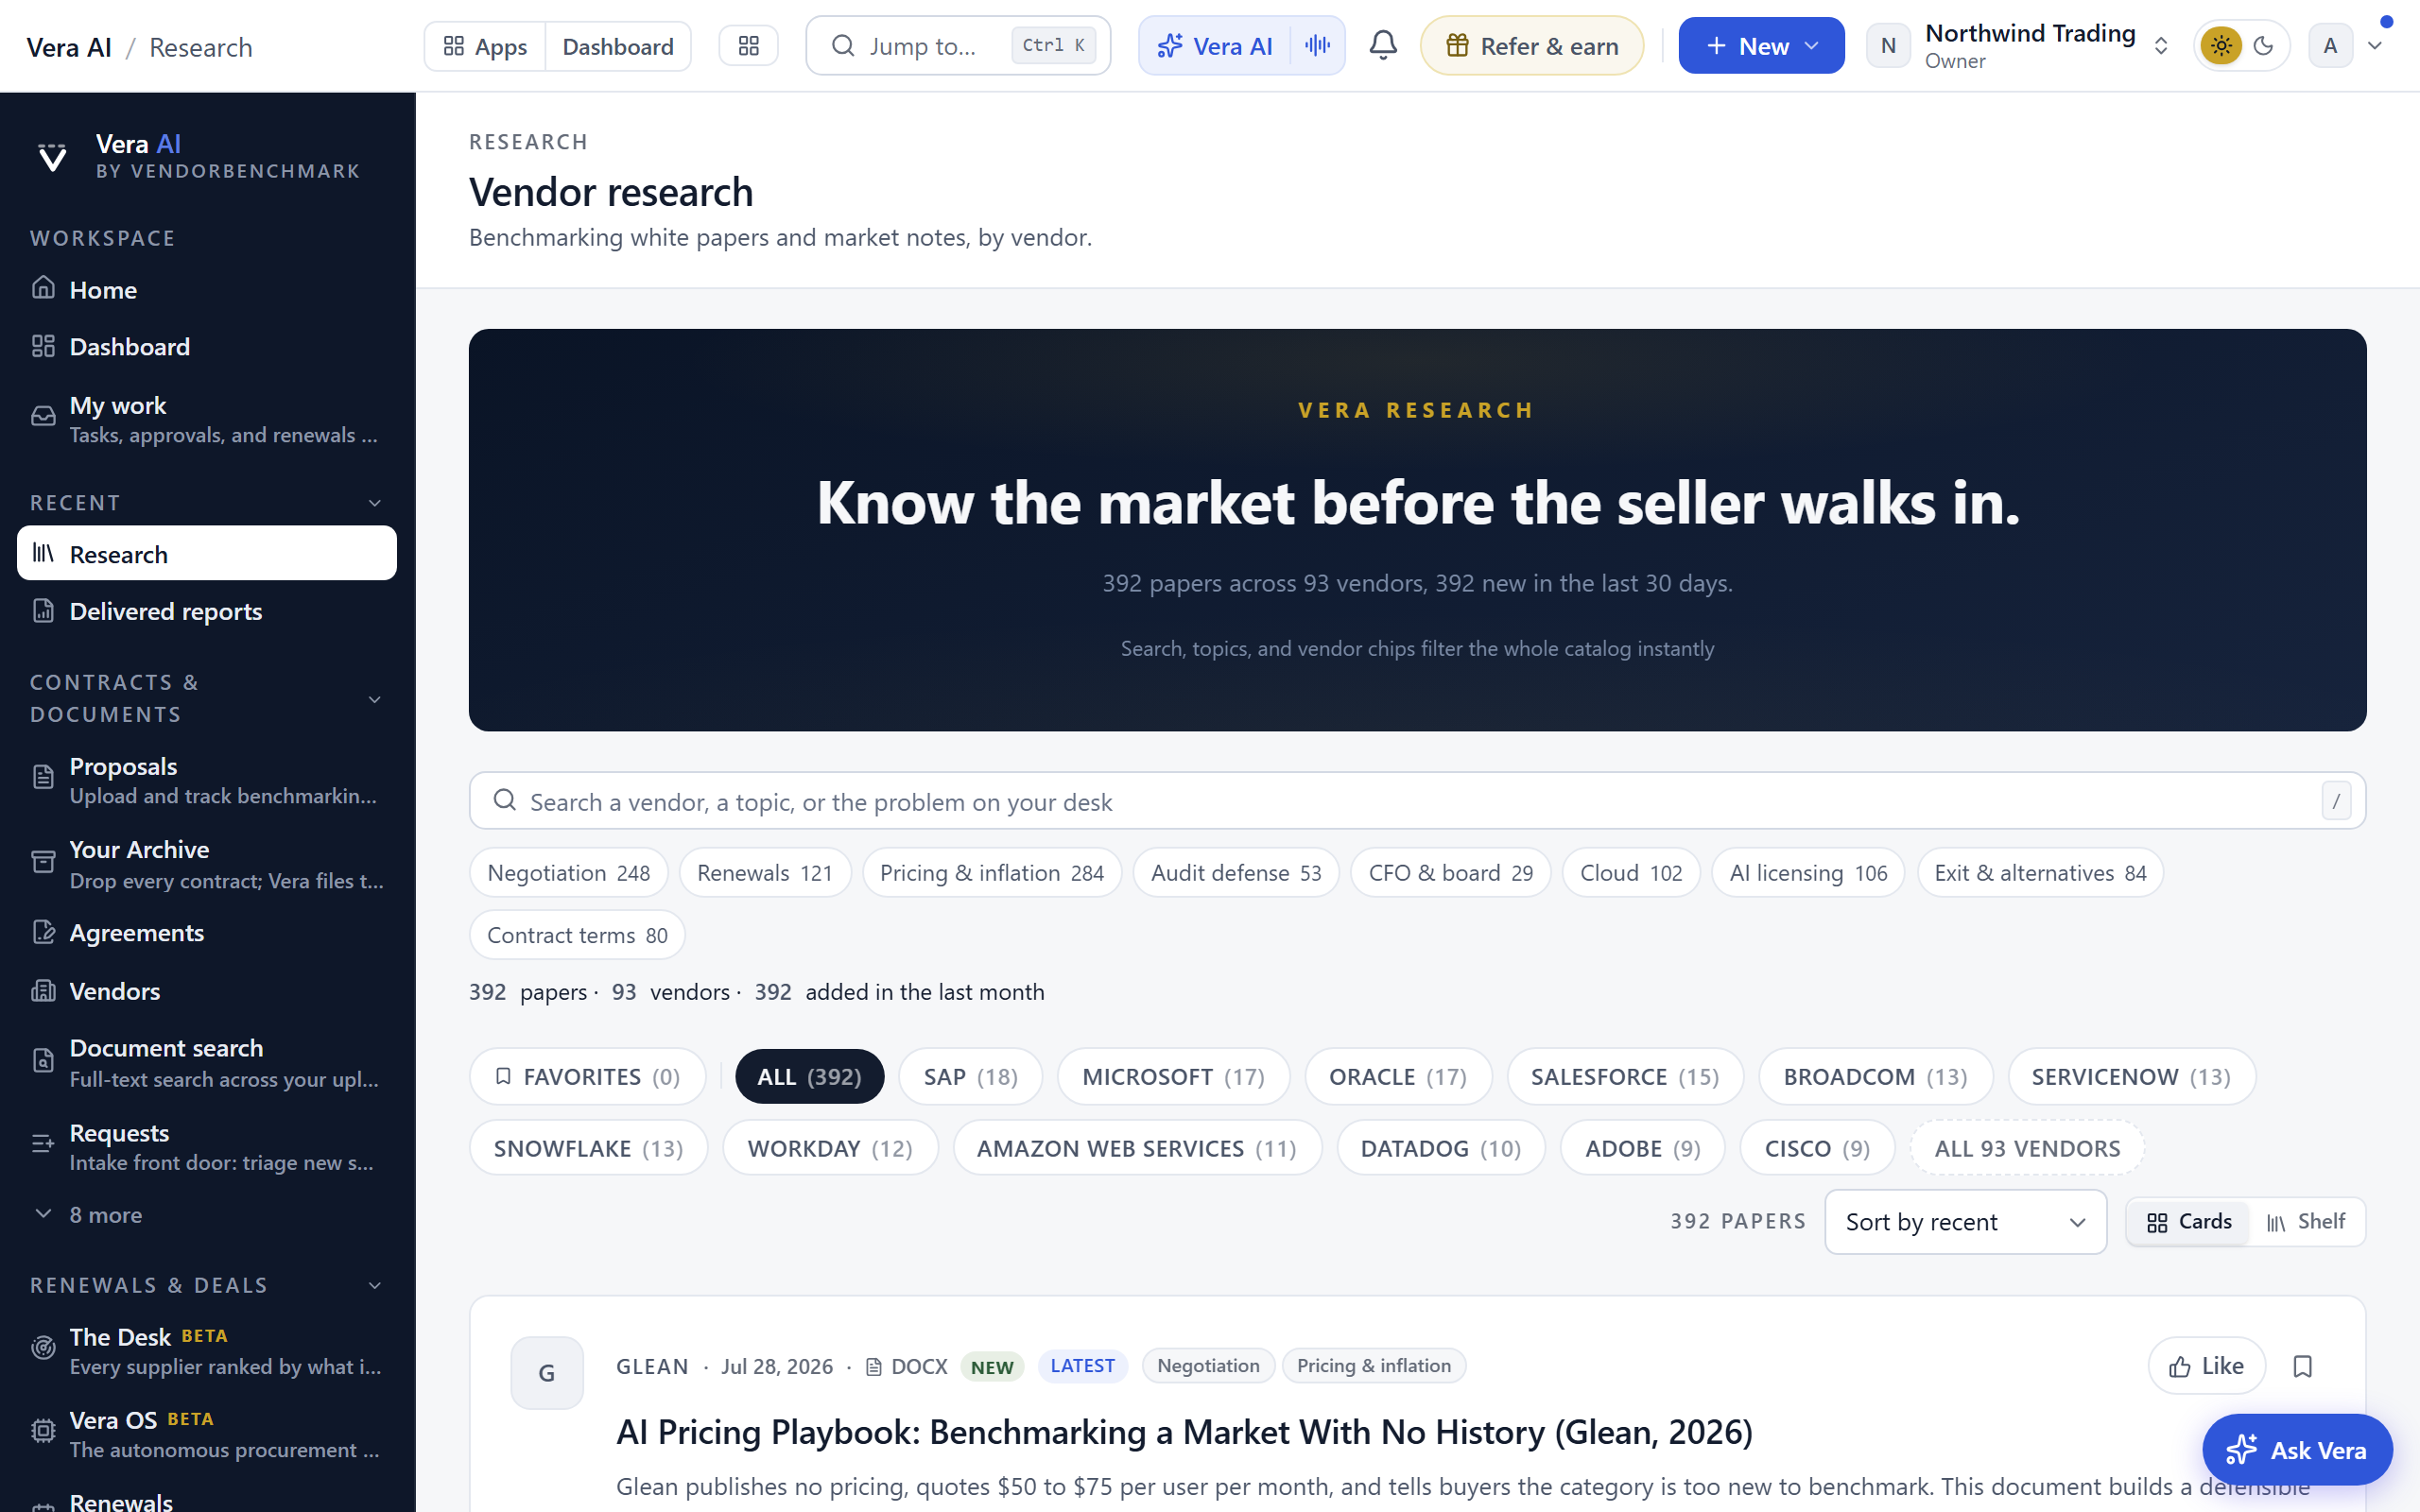
Our latest white papers and market notes: vendor pricing moves, licensing changes, and negotiation guidance, opened as the library's own application window.
*In plain words: the library as an application. One bar asks and filters at once, the desk rail keeps what you were reading, the cover wall fills the stage while you browse, the open paper takes the whole stage at the depth you choose while you read, and the inspector holds the contents with the five papers to read next, Ask Vera, your clips, and the vendor's file. The sun and moon in the titlebar flips the whole account between light and dark without leaving the library. Closing the window returns you to Home; the previous two pane page was retired on 25 August 2026, so the window is the library.*
Ask Vera what to read. The button on the wall, under the four figures. The library holds thousands of papers and only a handful are yours this week, so name the vendor, the renewal or the question and Vera picks from your shelf. Two to five papers come back, best first, each with a line on what that paper gives you and what you will be able to do once you have read it; press one to open it. A paper on a vendor you actually hold outranks a better paper on one you do not, and the answer says so when that is the reason.
- It picks, it does not answer. The papers carry the argument. Vera says which one to read and why, which is a different job from the written answer in the Ask tab on the right, and it comes back in seconds rather than about a minute.
- It can only name papers we hold. Every suggestion is checked back against your own shelf before it reaches you, so nothing it offers is a paper you cannot open.
- Keep talking to narrow it. Only the Oracle ones, something shorter, what about the terms. Each reply carries two or three follow ups worth pressing.
- If Vera cannot answer, the closest papers on your shelf stay on screen and the panel says so. A shelf is still an answer.
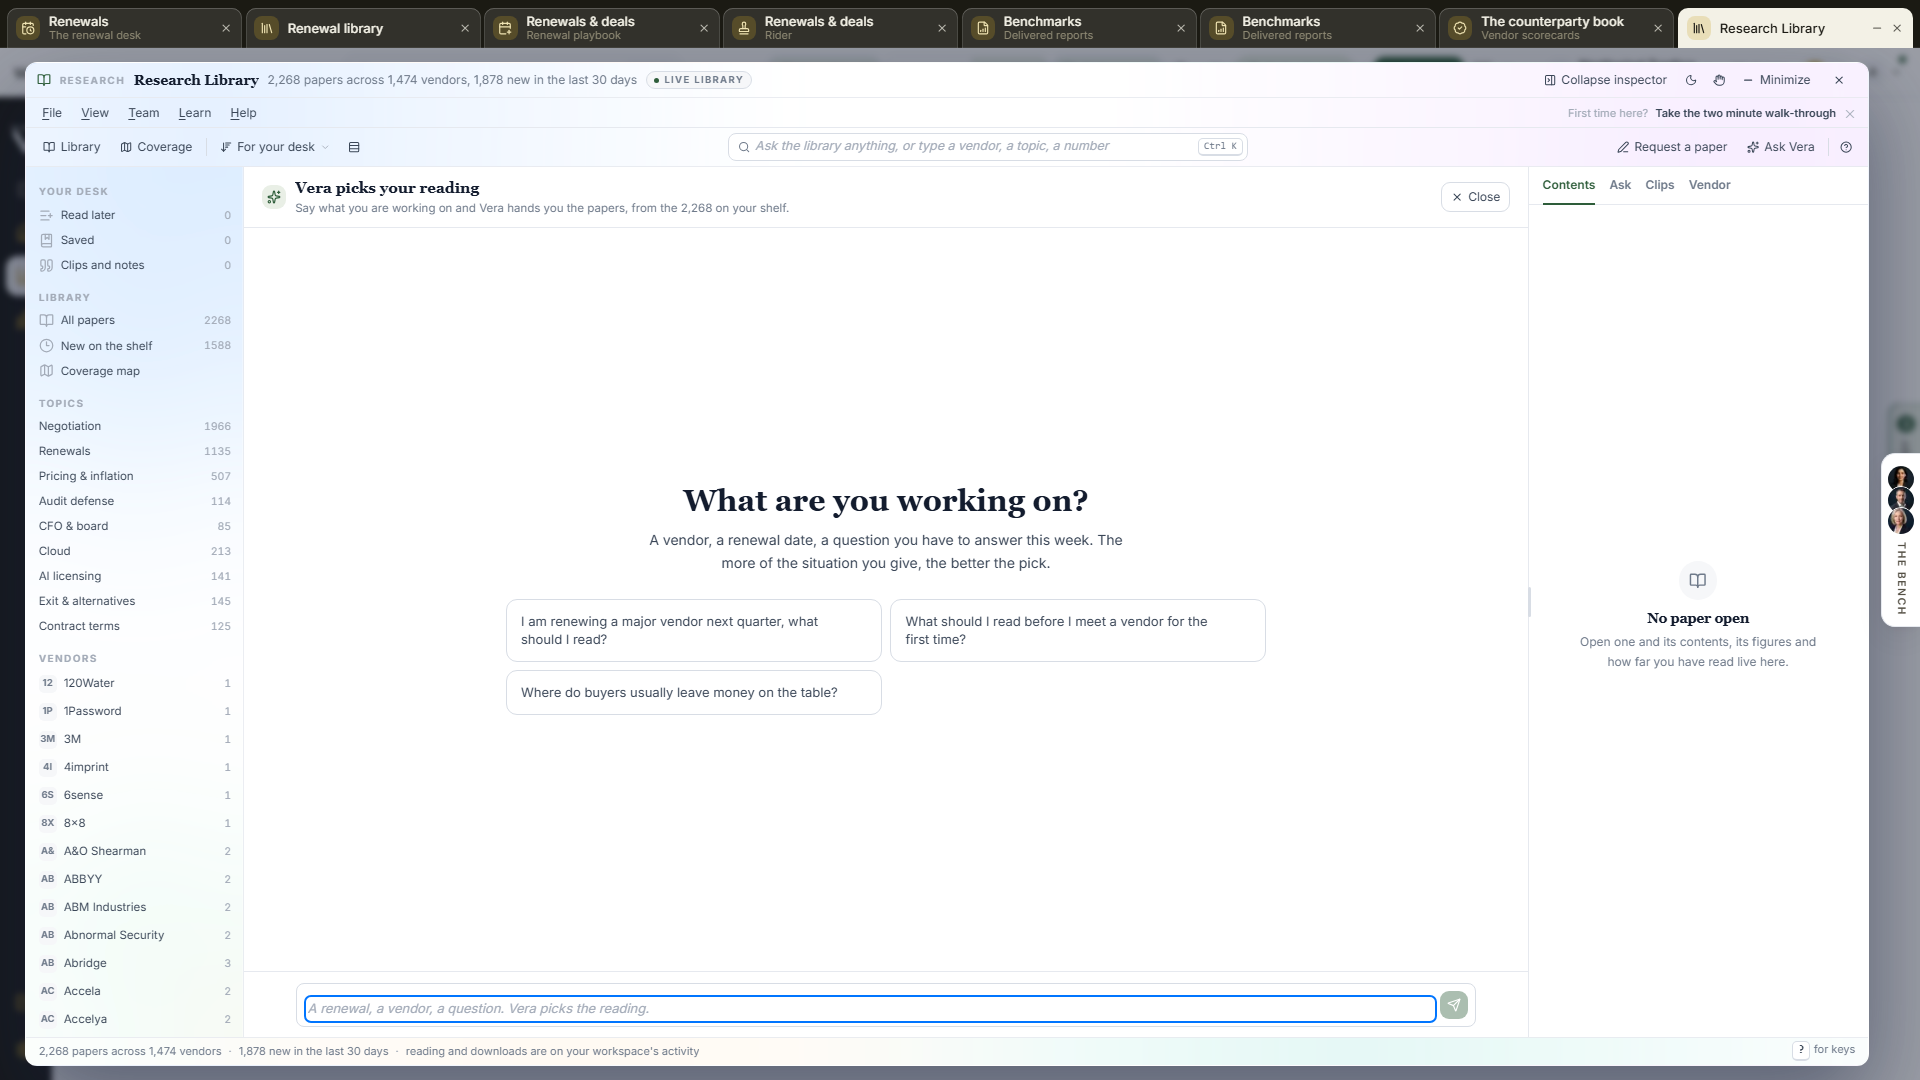
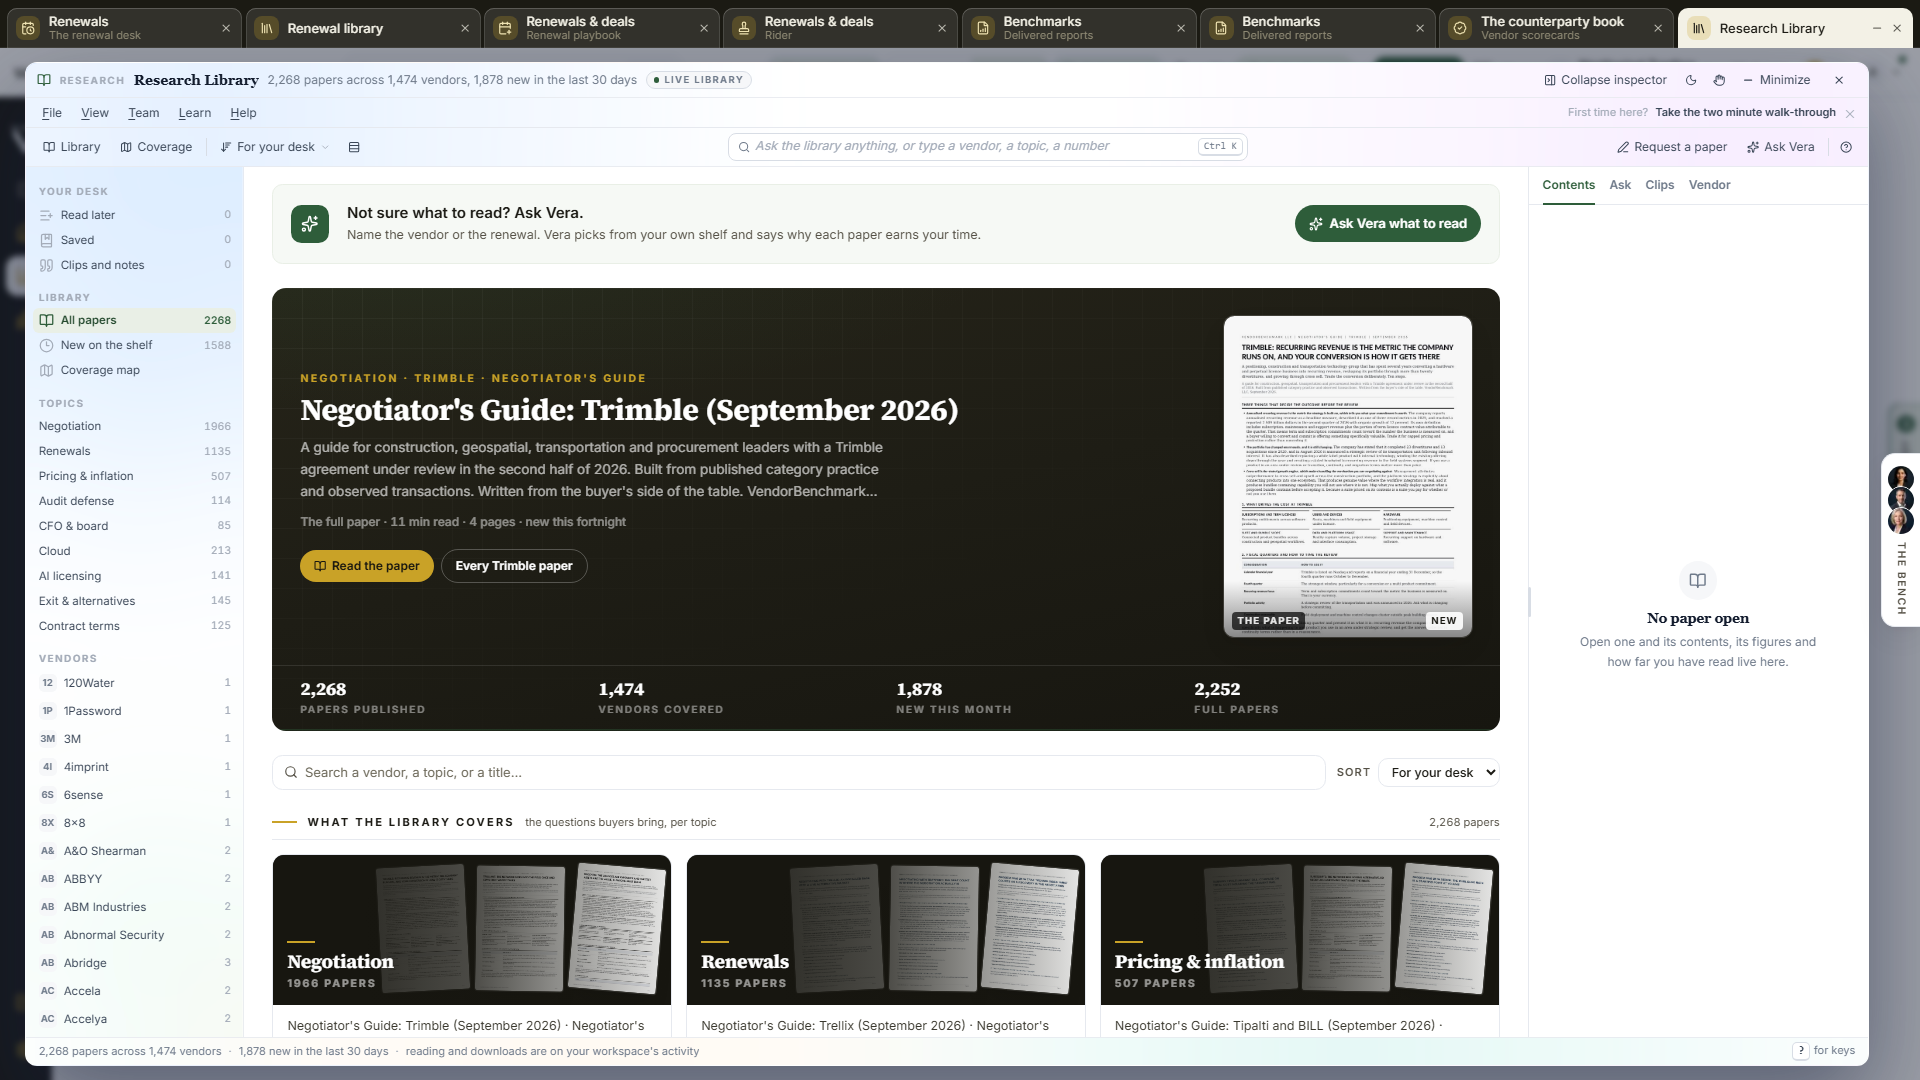
What the wall counts. The four figures over the cover wall state your whole shelf, not the part of it on screen: every paper your desk can reach, the vendors those papers cover, how many arrived in the last 30 days, and either the papers on vendors your workspace holds or the papers that render in full. They count your spend desk, which is what the shelf below them carries, so on Information Technology and Software the wall reads 2,268 papers across 1,474 vendors of the 2,602 across 1,540 the library holds in total, and it changes when you change category in the header. Every figure is counted in the database rather than measured off the papers already loaded, so the number over the shelf and the papers on it can never disagree.
The library opens on your spend category. The shelf carries the papers written for the desk you are working in and switches when you switch category in the header: 587 on Information Technology and Software, 75 on Travel and Entertainment, 54 on Professional Services, 51 each on Facilities and Office Services, Marketing and Workforce, and 26 each on MRO and Logistics. A paper we cannot place to a category stays on every shelf, because general reading about negotiation or funding a case with the CFO belongs to everybody. Looking a vendor up by name, a specialist's own reading pack and the staff view are not filtered: there the subject is already chosen.
Every supplier we benchmark has a paper behind it. The curve document that sets a supplier's benchmark is itself a research paper, and all 324 of the indirect ones are on the shelf: how the commercial model works, the structural anchors with their published sources, the curve with the evidence grade for each line, how to read it, the adjustment factors, the plays to run and where every figure came from. Read it on the page like any other paper (Enterprise workspaces download it as a Word document), or open the supplier's benchmark from it.
When to reach for this
- A renewal is coming and the vendor's Negotiation Toolkit and Renewal Outlook are the homework.
- Something moved in the market (an audit campaign, a licensing change) and you want the considered read, not the headlines.
- Ten spare minutes: the Most liked shelf is reliably worth them.
The series you will find here
- Negotiation Toolkit — one per covered vendor: the levers, the counters, and how to run the deal.
- Negotiation Intelligence Report — for the major vendors: the seller's calendar, comp plan, and tactics decoded.
- Renewal Outlook (quarterly, top 10 vendors) — what your renewal will cost in the next 12 months and what to lock in now: announced price changes with dates, uplift corridors, and a month-by-month timing calendar.
- Vendor Strategy & Viability Assessment (annual, top 10 vendors) — where the vendor is taking pricing, packaging, and product, what that does to your cost curve, and a closing posture recommendation.
- Negotiation Playbook — the long form preparation document, one per vendor or category: what changed since you signed, the renewal runway month by month, the position to build, the give and get table, the vendor's own plays with your counters, the concessions a good close contains, and the mistakes that cost the most.
- Category negotiation playbook — one for each of the seven categories that are not software, written from that category's own curve set: where the money actually moves, which clauses carry it, which suppliers are in a position to concede at all, which arguments reliably fail, and how to read the playbook beside the curves. Each sits on its own desk's shelf, carries its version and next review date, and is one press away from the category's home and from every indirect supplier's benchmark sheet.
- Call Scripts — the three call brief: word for word openings, the counters to the answers you will get, and the close for the first, second and third call, plus what to assemble before you dial and the one page to bring to every call.
- Discount Curve Benchmark — one per covered vendor: the full discount curve by deal size, what comparable buyers are offered at each size, the levers worth points, the contract terms that decide the next renewal, and every source named. It is the evidence behind that vendor's benchmark tool, and it stands on the research shelf that closes the tool page.
- Negotiation Dossier — one per vendor we hold a dossier on, 93 since 3 September 2026, the same eight sections every time: how the vendor sells and who is on the account team, how the field is paid, the fiscal calendar with its pressure windows drawn month by month, this year's push list, the contract vehicles, the discount mechanics beyond the curve, the renewal and audit traps, and the recommended asks. Every claim carries its grade, published, reported or typical practice, and the dossier states no discount figure, because the benchmark sheet owns every number. It is the same document the vendor's specialist argues from, so what the seat knows and what you read are one page.
- Negotiator's Guide — one per vendor we have published a guide for, 1,412 since 9 September 2026: the three things that decide the outcome before the quote arrives, the six factors that set the number, the vendor's fiscal calendar and where the leverage sits in it, the runway week by week, the benchmarks line by line, the tactics that work, the ten step playbook with what to say and what to hold out for, what most buyers miss, and the clauses to check before you sign. It is the same document the Benchmark Library sheet renders under What moves this vendor's number, opened here as the designed file itself, page for page.
- Topical papers on specific market events, such as licensing policy changes and audit campaigns.
Ask where a figure comes from, and the paper opens there. When a specialist on the line, or a typed answer, rests a range or a claim on our research, ask where it comes from and the specialist names the paper and the section and opens the paper scrolled to that section; a passage the research could not place opens the paper at the top and the specialist says so rather than pretending. Under a typed answer, every research citation in What Vera checked is a link to the paper at its passage. With a paper open in the window, say section four, the sell motion, next section or scroll down and the page moves, the specialist confirms what landed, and the specialist knows which paper and which section is in front of you.
Back to the vendor. Filter the library to a vendor your workspace holds paper with and a line under the chips opens that vendor's record, where the papers sit beside the agreement, the renewal, the benchmark, and the films.
For covered vendors, the newest Renewal Outlook also appears automatically on that vendor's renewal, contract, and negotiation pages, and the assessment on the vendor's page, so the right paper is at hand where you work the deal.
On the screen
- The answer bar — one field in the window's chrome is both the ask and the filter. Press Ctrl/⌘ K or / from anywhere in the window and type: the wall narrows live on every keystroke while the drop offers where to land, the matching papers, the sections inside them, vendor dossiers, topics, and Ask Vera on the question itself, grounded on the shelf. The arrow keys move down the drop and Enter opens the lit row. A search that matches nothing offers to request the paper instead of apologizing.
- The desk rail — the left rail is your desk. The paper you left mid read sits at the top with its minutes left, one press to resume. Below it: your Read later queue, your Saved papers, your Clips and notes, the library's own doors (all papers, what is new, the coverage map), Your vendors when your book holds any of them, every topic with its live count, the vendors you follow (a green dot marks new work you have not read), and every covered vendor A to Z with its count, the way the Renewal Library lists its own. It closes with The other libraries: the Benchmark Library for what a deal should cost, and the Renewal Library for what to do at the renewal.
- The wall — where the library opens, laid out exactly as the Renewal Library since 7 September 2026, so the two libraries read as one product. A navy stage leads on one paper (a new paper for a vendor you hold, else the newest with a printed cover) with its cover beside it, Read the paper and Every <vendor> paper under the summary, and four counts across its foot: papers published, vendors covered, new this month, and on your estate. Then the search and the sort, the topic plates (each wearing the covers of the papers behind it, one press to that shelf), and The shelf: the current cut as cards, four or five across, each with its cover, the vendor and series kicker, the title, a line of summary, its first topic and the reading time. A paper that arrived as a designed PDF wears its real first page, and a paper written from data wears the drawn briefing cover. Your vendor rides the covers of the vendors in your own book, New the papers from the last two weeks, and a thin progress line the ones you are mid way through. Press v for the dense ledger instead: one row per paper with the series, the reading time, and the stamp. Press a cover and the paper takes the wall's place, so the page reads at full width with nothing beside it but the inspector. Library in the command bar, any topic or vendor in the rail, or Esc brings the wall back on the same cut; a second Esc clears the cut.
- The depth dial — every paper reads at three altitudes, derived live from the same document so nothing can drift: The brief (90 seconds, one line per section and the bottom line), The read (about five minutes, each section's opening and its tables), and The paper (the whole document). Keys 1, 2, 3.
- The numbers strip — the paper's figures as chips above the page, the headline numbers first, then the first figure each section states. Press one and the stage jumps to the line it came from.
- The curve lever — when the paper's vendor has a documented discount curve, a lever sits above the paper: the peer band from low to strong with the midpoint marked. Drag the dot to any discount and the rank reads live (Poor to Top of the market, with the gap in points); one press tests the same figure in the Benchmark Library window.
- The note reader — every note opens as a real PDF at the paper depth: a note that arrived as a designed document opens as that file, page for page, and a note written from data opens as the PDF printed from it on the briefing design. Press The paper (or Open reader on the toolbar) and the reader pops up over the whole screen: a title bar with the note's name and series, Contents read from the note's own headings with page thumbnails beneath, page controls, zoom with Fit width and Fit page, Find in this note with a live count, Save PDF and, for a note written from data, Word where your plan carries downloads, Print, Open PDF, Full screen, and Esc to close. Pages draw at your screen's pixel density, so the type is as sharp as the file. Nothing is re-typeset. In a narrower pane the four file controls show as their icons alone so the toolbar stays on one row; their names are on hover, and they return at wider sizes.
- The paper page — a note written from data is printed as a PDF on the negotiation briefing template: the gold kicker naming the firm, the series, the vendor and the month over a gold rule, the navy title, the grey dek and the italic audience note, the cream panel with the numbers that matter, navy section headings over gold rules, gold bullets with bold lead phrases, the benchmark tables, the closing bottom line and firm block, and a footer with the page number. The Word download is the same document; the brief and the read depths are the on-screen summaries of it.
- Clips — select any passage on the page and a small toolbar appears: Clip keeps it with its citation on your desk, Ask Vera asks about the passage, and Copy with citation puts it on the clipboard ready for a deal file. The Clips tab collects the set and Copy all exports every clip, citations kept.
- The inspector — four tabs beside the stage. Contents: your reading progress and every section, following your place as you scroll and jumping on a press, then Read next: the five papers closest to the open one by series, vendor and topic, as small covers with the title and the reading time under each, a tick on the ones you have already read, and a More on the shelf tile that opens the wall cut to that vendor. It is the same five the stage offers under the last line of the paper, so the shelf continues on the right while you read. Ask: Vera, grounded on the open paper and your workspace. Clips: what you have kept. Vendor: the vendor's file, its documented curve figures, your own contracts with that vendor, its shelf, and the door to the full dossier.
- Vendor dossiers — every vendor opens as a place, not just a filter: its papers shelved by series, its documented peer midpoint and band, your contracts with the vendor from your own workspace, and the newest additions. Follow marks new work in your rail; it is opt in and sends nothing.
- The coverage map — vendors against topics as a depth grid, counted live from the shelf. A deeper square means more papers on that cut; press any cell to land on it, and a blank cell is one press from a request.
- Sorts — For your desk (the vendors you hold first, then fresh work, then the stamp), most recent, Most liked (voted by readers across the whole customer base, totals only), and shortest read. A search re ranks by relevance while it is active.
- Reading mode — r or the focus button clears everything but the paper; Esc returns. Previous and Next (or the arrow keys) walk the wall's exact order, and j and k walk the sections of the open paper.
- Share link and Forward — on the stage's action row. Share link creates a public link and copies it: anyone with the link can read that one paper for 90 days, no account needed. Forward emails the paper to up to five colleagues with an optional personal note. The like button and the bookmark sit beside them, one press each.
How to use it
- Press Ctrl/⌘ K and type what is in front of you, a vendor name, "audit", "what uplift cap do peers sign". Open the paper, the section, or the dossier straight from the drop, or press Ask Vera and get the answer itself.
- Short on time? Press 1 and read the brief in 90 seconds; the full paper is one press away and your place keeps either way.
- While you read, clip the passages worth keeping: select, Clip, and the citation rides along. Copy all in the Clips tab hands the set to your deal file.
- Work a vendor from its dossier: the shelves in series order, the documented band, your own contracts beside them, and Follow so new work finds you in the rail.
Downloads are an Enterprise feature. Every plan reads every paper on the page, at all three depths, with no cap on reading; the Word and PDF files leave the library on Enterprise only. On Growth and Professional the action row shows Downloads on Enterprise where the Download chip would be, and pressing it says what to do instead: keep reading here, Share link a public copy, or Forward the paper by email. The PDF viewer on those plans reads without its save toolbar, and Open in tab is an Enterprise control too. On Enterprise, file downloads are capped at ten per day and thirty per week per person so access stays fair across organizations; the allowance frees up on its own as your recent downloads age out, and if you need more before then a VendorBenchmark admin can reset it for you right away. All platform limits are collected in Plans, allowances & limits.
On a trial: the library reads but does not download. A trial workspace opens 10 papers, in full and online. Papers you have already opened stay open, and reopening one never costs another, so the 10 is 10 papers rather than 10 clicks. Partner-program firms read online without downloads too, per program terms, whatever their plan. See What the trial includes.
Related: Saved · Vendor scorecards
The benchmark library
*In plain words: every vendor opens the benchmark sheet. The advanced view under it is the instrument bench: the levers, your saved scenarios, the comparison cut by size, industry and region, the case file, and the research behind the vendor.*
One vendor is different, on purpose. The Oracle ULA benchmark keeps this reading as its page rather than the sheet. A ULA has no list price and no discount to rank: it is priced on the fee per product, so the three questions the sheet answers have no honest answer there. Everything else in the library opens the sheet.
The library is not only software. 324 indirect suppliers carry their own curves alongside the software vendors: 50 in facilities and office services, 50 in professional services, 50 in marketing and advertising, 50 in HR and workforce, 74 in travel and entertainment, and 25 each in MRO and consumables and in logistics and fleet. Sodexo, ISS Facility Services, CBRE and Compass sit beside Kuehne+Nagel, DHL and Maersk, beside WPP, Omnicom, Publicis, Ogilvy and Kantar, beside Randstad, Adecco, Mercer and Korn Ferry, beside Marriott, Hertz, Ryanair and Eurostar, beside Grainger and Fastenal. Each states the median outcome with the p05 to p95 range across four contract size bands, on the commercial lines that supplier actually sells.
Some curves measure a rate, not a discount, and lower is better. Most indirect money is a management fee, an overhead and profit percentage or a markup rather than a reduction off a list price, so 66 of these suppliers are benchmarked on the rate they charge. On those the sheet inverts: the low end of the band is the good end, a quote at the top of the range is the weak one, and the fee falls as the contract grows rather than the discount deepening. The page says which of the two you are reading, because reading a fee rate as a discount would rank the worst quote as the best. Twelve of them are quoted in basis points, where 210 means 2.1 percent, and the page says bps rather than printing a fee of 210 percent.
Where the evidence is thin, the curve says so. Indirect suppliers publish no price lists, so many of these lines are graded on adjacent evidence and carry a deliberately wider band. That is stated on the line rather than hidden, and each curve names the date it is next due for review.
The library is scoped to your desk. The A to Z lists the suppliers of the spend category you are working in, not all of them at once: 52 on Facilities and Office Services, 84 on Human Resources and Workforce, 58 on Professional Services, 81 on Travel and Entertainment, 55 on Marketing and Advertising, 30 on Logistics and Fleet, 28 on MRO and Consumables. A desk keeps the software it genuinely licenses, so Planon and Accruent stay on the facilities shelf and Workday on the workforce shelf, because the category's own vendor lists name them. Information Technology and Software lists the whole software estate exactly as it always did. Switch category in the header and the library switches with you, and the find field searches the shelf you are on.
323 of the 324 have a benchmark page of their own. Since 31 August 2026 every indirect supplier in the library opens at its own address the way a software vendor does, with the advanced view and the instant check: 50 in facilities, 50 in professional services, 50 in marketing, 50 in workforce, 73 in travel, 25 in MRO and 25 in logistics. The one exception is Robert Half, whose markup line sits above the ceiling the curve gate allows a peer set, so it stays on the shelf as a curve without a page and the shelf says so. They arrive on three meters, because indirect spend is not bought one way. Most state a discount off a rate card, a list or an opening quote. Forty eight state a rate, where a lower number is the better outcome and the fee falls as the contract grows: ABM Industries, Aramark, Compass Group and G4S on the management fee, DSV and Flexport on the share of freight spend placed. Ninety band on a count rather than on money, because that is where their leverage sits: Otis, KONE and Schindler on lifts under maintenance, IWG on desks, Marriott, Hilton and Hyatt on room nights, Maersk and CMA CGM on containers, Xerox on pages printed, Ryanair and easyJet on annual sectors flown. Two buyers spending the same amount can sit in different bands on those, which is the point. Eighty three band in the currency the supplier quotes, and those keep the document's own currency on the band while your figures are compared in dollars at a rate printed on the page: a European buyer with a three million euro contract sees a band that says euros. You can enter euros, pounds, Swiss francs and Swedish, Norwegian or Danish kronor directly. The peer set behind every page is modeled to the curve its own document states rather than drawn from observed deals, and the page says so. Four suppliers carry two tools on purpose, because Magnit, Beeline, SAP Fieldglass and TravelPerk are benchmarked both on discount off their contract value and on the programme fee itself, which are different numbers.
Two views, one address. Opening a vendor gives you the benchmark sheet described under Benchmark Library: your discount, what comparable buyers get at your size, where the deal ranks, the curve with your deal on it, the ranked comparables, and the bottom line. Every vendor in the library opens that same sheet, whether an analyst has written its curve up as a document or the range is measured on the vendor's own reference deals, and the sheet always says which of the two you are reading. The advanced view, one press away under View, Advanced view, or the a key, is everything on this page: the deal structure levers, saved scenarios, the comparison suite, the benchmark case with its rooms, the email desk, and the research shelf. Press Back to the benchmark at the top of it to return.
When to reach for this
- The vendor you are negotiating has its own page here; this is the deep tool the hub's search lands you on.
- The deal prices on an unusual meter (cores, FUE, endpoints, trader seats): the page names the unit that actually bills you.
- You want the full case treatment: the placed verdict opens as a four document benchmark case with the ask sheet scripted.
The Benchmark Library is a front door to roughly 1,600 individual vendor tools, one page per vendor and product line, from Microsoft EA and RISE with SAP to Snowflake, CrowdStrike, and Autodesk, including the AI tool stack (AI coding assistants, model and inference APIs, GPU cloud, data labeling, voice, and video) and the Google estate (Google Ads, YouTube, Marketing Platform, Analytics 360, Maps Platform, Mandiant, Cloud Support). Each page is a self-serve price check: you enter your own numbers and see where your deal lands against a cohort of comparable transactions, with no upload and no wait.
Real estate and staffing are covered as industries rather than as a handful of names. On the property side, alongside Yardi, RealPage and MRI Software the library prices CRE data and marketplaces (CoStar Group, Cotality, Altus Group), property management platforms (AppFolio, Entrata, Storable), leasing, deal and investment management (VTS, Dealpath, Juniper Square), and worktech, lease accounting and residential brokerage (Eptura, FinQuery, HqO, Lone Wolf). On the staffing side, alongside Bullhorn, Beeline and iCIMS it prices the agency front and back office (Avionté, TempWorks, Crelate, Loxo, Daxtra), talent engagement and experience (Sense, Phenom), recruitment marketing and job advertising (Radancy, Appcast, ZipRecruiter, DHI Group), and the PEO and staffing payroll platform underneath (PrismHR). Neither industry meters per employee, so each page names the unit that actually bills you: per unit under management, per facility, per building, per lease, per recruiter seat, per active job slot, per worksite employee. Four of these pages are built on a published rate card, and two of those tell you the escalator matters more than the discount, because Crelate publishes a 7 percent annual price rise and Loxo is reported at 5 percent.
Retail and commerce has its own category on the hub. It covers the enterprise store estate (Aptos ONE, Cegid Retail, Diebold Nixdorf Vynamic, Toshiba ELERA, Zebra Workcloud), the shelf and the shrink stack (VusionGroup electronic shelf labels, Nedap iD Cloud RFID, Sensormatic, Everseen checkout vision AI, Scandit smart data capture), merchandising, planning and shopper data (SymphonyAI Retail CPG, ToolsGroup, Impact Analytics, dunnhumby, Placer.ai, alongside Blue Yonder and Oracle Retail), digital commerce, marketplace and channel (VTEX, Spryker, Mirakl, Rithum, alongside Shopify Plus, BigCommerce, commercetools and Salesforce Commerce Cloud), product and customer content (Syndigo, Akeneo, Bazaarvoice), and fulfilment, post-purchase and the frontline workforce (Fluent Commerce, Narvar, WorkJam). Retail almost never prices per employee, so each page names the meter that actually decides the bill: per terminal or per store, per lane, per shelf label, per RFID tag, per named planner, per seat, per order, per SKU and recipient, as a share of gross merchandise value, or per frontline employee. Several of these pages say plainly that the discount is not the lever and explain what is, because the money in a retail contract is usually somewhere else: the consumable tag schedule behind an electronic article surveillance install, the year-seven shelf label replacement price, the double-run between an old point of sale maintenance line and its cloud replacement, the take rate rather than the subscription, and the seasonal headcount a frontline licence is struck against.
Energy and utilities is a category of its own, and it is the largest single build in the library. It runs from the operating estate of a utility (ADMS and SCADA, DERMS and virtual power plants, metering and the grid edge, vegetation and asset inspection, crew and field service, retail energy platforms, water data) through oil, gas and industrial operations (subsurface and drilling, production and upstream ERP, pipeline and terminal, industrial analytics, machine health, maintenance management) into energy trading and markets (E/CTRM, trade surveillance, market data and price reporting, power forecasting) and the clean energy transition (storage optimisation and battery analytics, electric vehicle charging, solar and wind design and performance, carbon accounting, utility data access, environment and safety, environmental commodity markets). Several of these are not licence deals and the pages say so rather than forcing them into a discount frame: an efficiency provider that installs equipment at no up-front cost and earns from your energy saving is a financing agreement, where the measurement baseline and the early buyout decide the cost, and a charging network that earns per kilowatt hour turns on who carries the demand charges when a fleet plugs in at once.
ITSM and ops covers the estate around ServiceNow rather than only ServiceNow, because the alternatives are what give a ServiceNow renewal any tension at all. Security is built the same way, covering the shortlist a buyer actually runs a platform against instead of only the platforms themselves. In both categories the page tells you where a credible alternative exists and where one does not, since a renewal with no second quote is a different negotiation from one with three.
Open source vendors that sell commercial support are covered as their own kind of deal, because the software is free and what you are buying is support, indemnification, certified builds, and long term security maintenance. Your genuine alternative is not a competitor, it is running the same software unsupported for nothing, so each page says where the community edition is already sufficient and where the subscription earns its place. The library covers databases and data platforms, Java runtimes, Linux and operating systems, private cloud, middleware and developer tools, content and collaboration, monitoring, and security tooling. Some are unusually clear cut: one monitoring vendor gates no features at all and sells only response time, one hypervisor is free to run in production with published per socket tiers, and one community platform has no paid tier to unlock, which makes a self host threat unusually credible. Two carry a specific threshold worth knowing before you open a quote: MySQL Enterprise does not discount below roughly $100,000 of annual value and then moves from 10 to 60 percent as the deal grows, and Azul runs 30 to 60 percent off list.
Advertising and media has its own category on the hub. Fifty vendors cover the stack a brand, an agency or a publisher actually signs for: the exchanges and supply platforms (Magnite, PubMatic, Index Exchange, OpenX, Equativ, Yieldmo, GumGum), native and content recommendation (Taboola, Teads, MGID), demand side platforms and media buying software (StackAdapt, Viant, Basis Technologies, Zeta Global, Adform, Moloco, MiQ, Smartly, Skai, alongside The Trade Desk and Criteo), verification and fraud (HUMAN Security, Zefr, Pixalate, alongside DoubleVerify and Integral Ad Science), audience measurement and the television currencies (Nielsen, Comscore, Kantar Media, VideoAmp, iSpot.tv, EDO, Samba TV), marketing effectiveness (Measured), mobile and app attribution (Adjust, Branch, Kochava, alongside AppsFlyer), shared advertising identity (ID5), agency ad operations (Mediaocean, which now owns Flashtalking and Innovid), out of home and audio (Vistar Media, Broadsign, AdsWizz, Triton Digital), search and AI visibility (BrightEdge, Conductor), affiliate and partnerships (impact.com, Awin), creators, social and communications (CreatorIQ, Later, Cision), creative production (Celtra, VidMob), supply path curation (Scope3) and consent management (Didomi). Advertising almost never meters per employee, so each page names the unit that actually decides the bill: a percentage of media spend for a demand side platform, a percentage of publisher revenue for an exchange, a cost per thousand impressions for verification and identity, a cost per attributed event for mobile measurement, a percentage of tracked sales for an affiliate network, and a price per screen for out of home. The published anchors sit on the pages: platform fees run about 15 to 20 percent of media and compress toward 7 to 13 percent above roughly $3m of annual spend, sell side take rates average about 14 percent of publisher revenue, and verification runs about $0.05 to $0.10 per thousand impressions. Several pages say plainly that the discount is not the lever and explain what is, because a measurement currency your television deals settle against and the workflow your agency bills through do not negotiate on rate. Ownership matters more here than in any other category, so each page names it: your mobile measurement partner may belong to a company that also sells you media, your audio technology may belong to one of the largest audio sellers, and your television data vendor may be part owned by the broadcasters it measures.
The library also covers professional services under its own category. Twenty services providers, from the strategy houses (McKinsey, BCG, Bain) and the Big 4 (Deloitte, PwC, EY, KPMG) through the global SIs (Accenture, IBM Consulting, Capgemini, NTT DATA), Booz Allen Hamilton, Slalom, Kyndryl, and the offshore majors (Cognizant, Infosys, TCS, Wipro, HCLTech, Tech Mahindra), are benchmarked on blended hourly rate per consultant rather than discount off list: enter your total fees and hours and see where your effective rate lands for that firm and engagement size, with your onshore/offshore delivery mix and commercial leverage as the levers.
Alongside those firms, the library benchmarks the four software vendors that also sell the services to implement their own software, one tool per practice rather than one per firm: ten Microsoft Industry Solutions Delivery practices (Azure infrastructure and migration, data and AI on Fabric, Copilot deployment, Dynamics 365 finance and operations, Dynamics 365 customer engagement, Microsoft 365 and modern work, security, Power Platform, app innovation, and industry cloud solutions), ten Oracle Consulting practices (Fusion Cloud ERP and EPM, HCM, SCM and CX, NetSuite, OCI migration, E-Business Suite, database and Exadata, Oracle Health, and managed services), twenty IBM Consulting practices split across its Strategy and Technology line (strategy, hybrid cloud and Red Hat, application modernization, data and AI, cybersecurity, the SAP, Oracle, Salesforce, Microsoft and AWS practices, IBM iX, finance, supply chain, talent, sustainability, quantum and mainframe) and its Intelligent Operations line (application managed services, business process operations, and cloud platform operations), and ten SAP Services practices (RISE adoption, S/4HANA brownfield conversion and greenfield implementation, premium engagement, SuccessFactors, Ariba, BTP, analytics, Signavio, and custom development). All fifty use the same blended hourly rate metric as the firm-level tools. The point each page makes is the same one: a vendor's own consulting arm can defend a premium for the work only it can credibly do, such as an SAP brownfield conversion or an Oracle database architecture with licensing consequences, and cannot defend one for the work a systems integrator delivers just as well, which is why the rates inside one vendor range so widely.
The largest publishers are covered by product line rather than as one tool, because they do not price as one vendor. Oracle has its own deep set: the Fusion cloud applications (SCM, EPM, and the CX suite of Sales, Service, Marketing, CPQ, and Commerce), Analytics Cloud, the industry clouds (Health, Retail, Hospitality, Financial Services, Utilities, Communications, Transportation Management, Field Service, Primavera Cloud), and the on-prem license and ULA-family estates (E-Business Suite, Siebel, JD Edwards, PeopleSoft, Hyperion, Primavera P6, Pool of Funds, and Perpetual ULA). Salesforce is broken out into Sales, Service, Commerce, Experience, Revenue (CPQ), Field Service, Platform, Agentforce, CRM Analytics, and the Health, Financial Services, and Nonprofit clouds. ServiceNow covers ITSM, ITOM, CSM, HRSD, SPM, Security Operations, IRM, App Engine, Field Service Management, and the Now Assist AI add-on. SAP covers S/4HANA (on-prem and RISE, with RISE Base and RISE Premium benchmarked on separate curves), GROW, Analytics Cloud, Datasphere, Integrated Business Planning, Fieldglass, Commerce Cloud, Sales & Service Cloud, Signavio, LeanIX, SuccessFactors, Ariba, Concur, and BTP (CPEA and BTPEA as separate tools). Pick the exact product line you are negotiating.
A further hundred and twenty five vendors joined the curve library on 30 August 2026, five in each of twenty five markets: supply chain and logistics, retail and hospitality, energy and utilities, real estate and construction, legal tax and insurance, manufacturing, agriculture and food, automotive and mobility, trust and physical security, marketing and creative production, the European and Nordic champions, Asia Pacific, IT services, pharma commercial and health data, gaming sport and venues, Latin America and the Middle East, data infrastructure and commercial open source, field service and equipment, information services and standards, nonprofit and philanthropy, cloud and cryptographic security, AI assisted software development, wholesale distribution, specialty and ancillary care, and travel and transport. They follow the same rule as the twelve above: the bands are the meter the vendor actually bills, licensed rooftops for a dealer management system, concurrent screening lanes for weapons detection, managed machine identities for certificate lifecycle, connected suppliers for food traceability, annual passengers boarded for airline retailing, and each commercial line carries the median with its p05 to p95 range and the grade of the evidence behind it. Twenty six of them are measured against a published list, thirteen against a published rate card, and the remaining eighty six against the vendor's opening quote, which the line says on its face rather than implying a list that does not exist. Four are priced as a rate rather than a discount, so their curves read lower as better and rank the way the uplift curves do: accesso on the ticketing fee, Xsolla on the platform fee, Pushpay on the all in cost of digital giving, and Web Travel Group on contracted margin. Where a document says a line is not offered at a given size, the curve says so and stays put.
Twelve vendors joined in August 2026, each with its curve document behind it, and each banded on the meter its vendor actually bills rather than on a dollar ladder: Anthology Blackboard by enrolled FTE students, Bitwarden by licensed users, Celigo by annual platform spend, Crusoe by committed GPU spend, Decagon by annual agent spend, DigitalOcean by committed cloud spend, Dremio by committed compute spend, Druva by committed credits, eClinicalWorks by provider count, EcoVadis by suppliers assessed a year, Equinix by committed power, and eSentire by protected assets. Five of them publish a real list price, so their curves are a discount off list: Bitwarden at $4 and $6 per user per month, eClinicalWorks at $449 and $599 per provider per month, DigitalOcean and Crusoe on their published cards, and Dremio on its published compute rate. The other seven publish nothing, so the curve is measured against the initial quote and the page says so rather than implying a list that does not exist. Two of the pages make a point the discount cannot: on eClinicalWorks the 2.9 percent of collections dwarfs the software line, and on Bitwarden the published ladder already undercuts the category by 25 to 50 percent, so a signature at list below a few hundred seats is simply the market.
The Microsoft EA tool models the November 2025 licensing change directly. Microsoft removed the EA volume discount levels for online services on November 1, 2025, so the tool carries a pricing era control: deals under the new rules benchmark roughly 10 points less discount than the legacy price sheet, unless the deal commits Copilot on an E5 (or E7) estate, which restores pre 2025 discount levels. Set the era to match your agreement; renewals still on a legacy price sheet keep it until they renew.
The SAP tools follow the August 2026 curve guideline: median discount off list with a p05 to p95 range, banded by ACV of the SAP component (under $500k, $500k to 2m, $2 to 10m, $10m and up). RISE Private Cloud has separate Base and Premium curves and separate tools, BTP has separate CPEA and BTPEA curves and tools, GROW carries the shallowest cloud curve, and S/4HANA on premises perpetual is shown as a reference curve only, because cloud and perpetual percentages are not comparable: a 55 percent RISE discount can beat a 70 percent perpetual discount once bundled infrastructure, support and managed services are counted. SAP ECC remains the exception: new ECC purchases price at list, with value delivered only through RISE conversion credits.
The Oracle applications estates (E-Business Suite, JD Edwards, and Siebel) share one discount curve, from the August 2026 curve documents: 50 percent off list is the median at the $100K deal minimum, climbing to 78 percent at $2m and above, so any offer under 50 percent reads as an opening position rather than a market price. The pages say why the discounts run this deep: they are nearly free for Oracle to give, because the commercial objective is the 22 percent support annuity on the net fee, which is why the escalation cap and repricing protection belong in the same negotiation as the rate. Oracle Java SE is the opposite: the published employee tiers already pre discount the rate, so negotiated discounts are thin by design (2 to 4 percent median below $2m of annual spend, 20 percent at $2 to 5m, 40 percent at $5m and above), and the tool carries a documented OpenJDK exit checkbox because the exit alternative, not the rate conversation, is what moves Oracle on Java.
The Oracle ULA benchmark is a deliberate exception to reading the discount at all. It opens with the fee curve by product scope: a focused 2 to 4 product technology ULA lands near $2m for a three year term, 5 to 8 products near $6m, 9 to 14 near $14m, and a 15 plus product estate near $30m, with your own scope and fee placed on the curve live. Beside it sits the signing reason multiplier, the largest hidden pricing variable in the deal: growth driven signings pay the baseline, renewals 1.1 to 1.3x, M&A driven deals 1.1 to 1.4x, and audit settlements 1.3 to 2.0x, because Oracle prices audit driven agreements to the exposure rather than the value. The how Oracle actually prices a ULA panel carries the negotiation guidance: keep growth estimates conservative because they are not contractual, always signal you may not renew, start your clock at least 12 months out (Oracle forecasts your pricing up to 11 months before expiration), sweep cloud and DR instances early because late sweeps came in 1.5 to 2.5x over expectations, and negotiate the terms that outlast the price (the certification clause, public cloud deployment rights, a support fee cap after the ULA ends, coverage for every legal entity, and merger and acquisition rights). A line under the play card links the Oracle ULA certification playbook for the renew or certify decision itself.
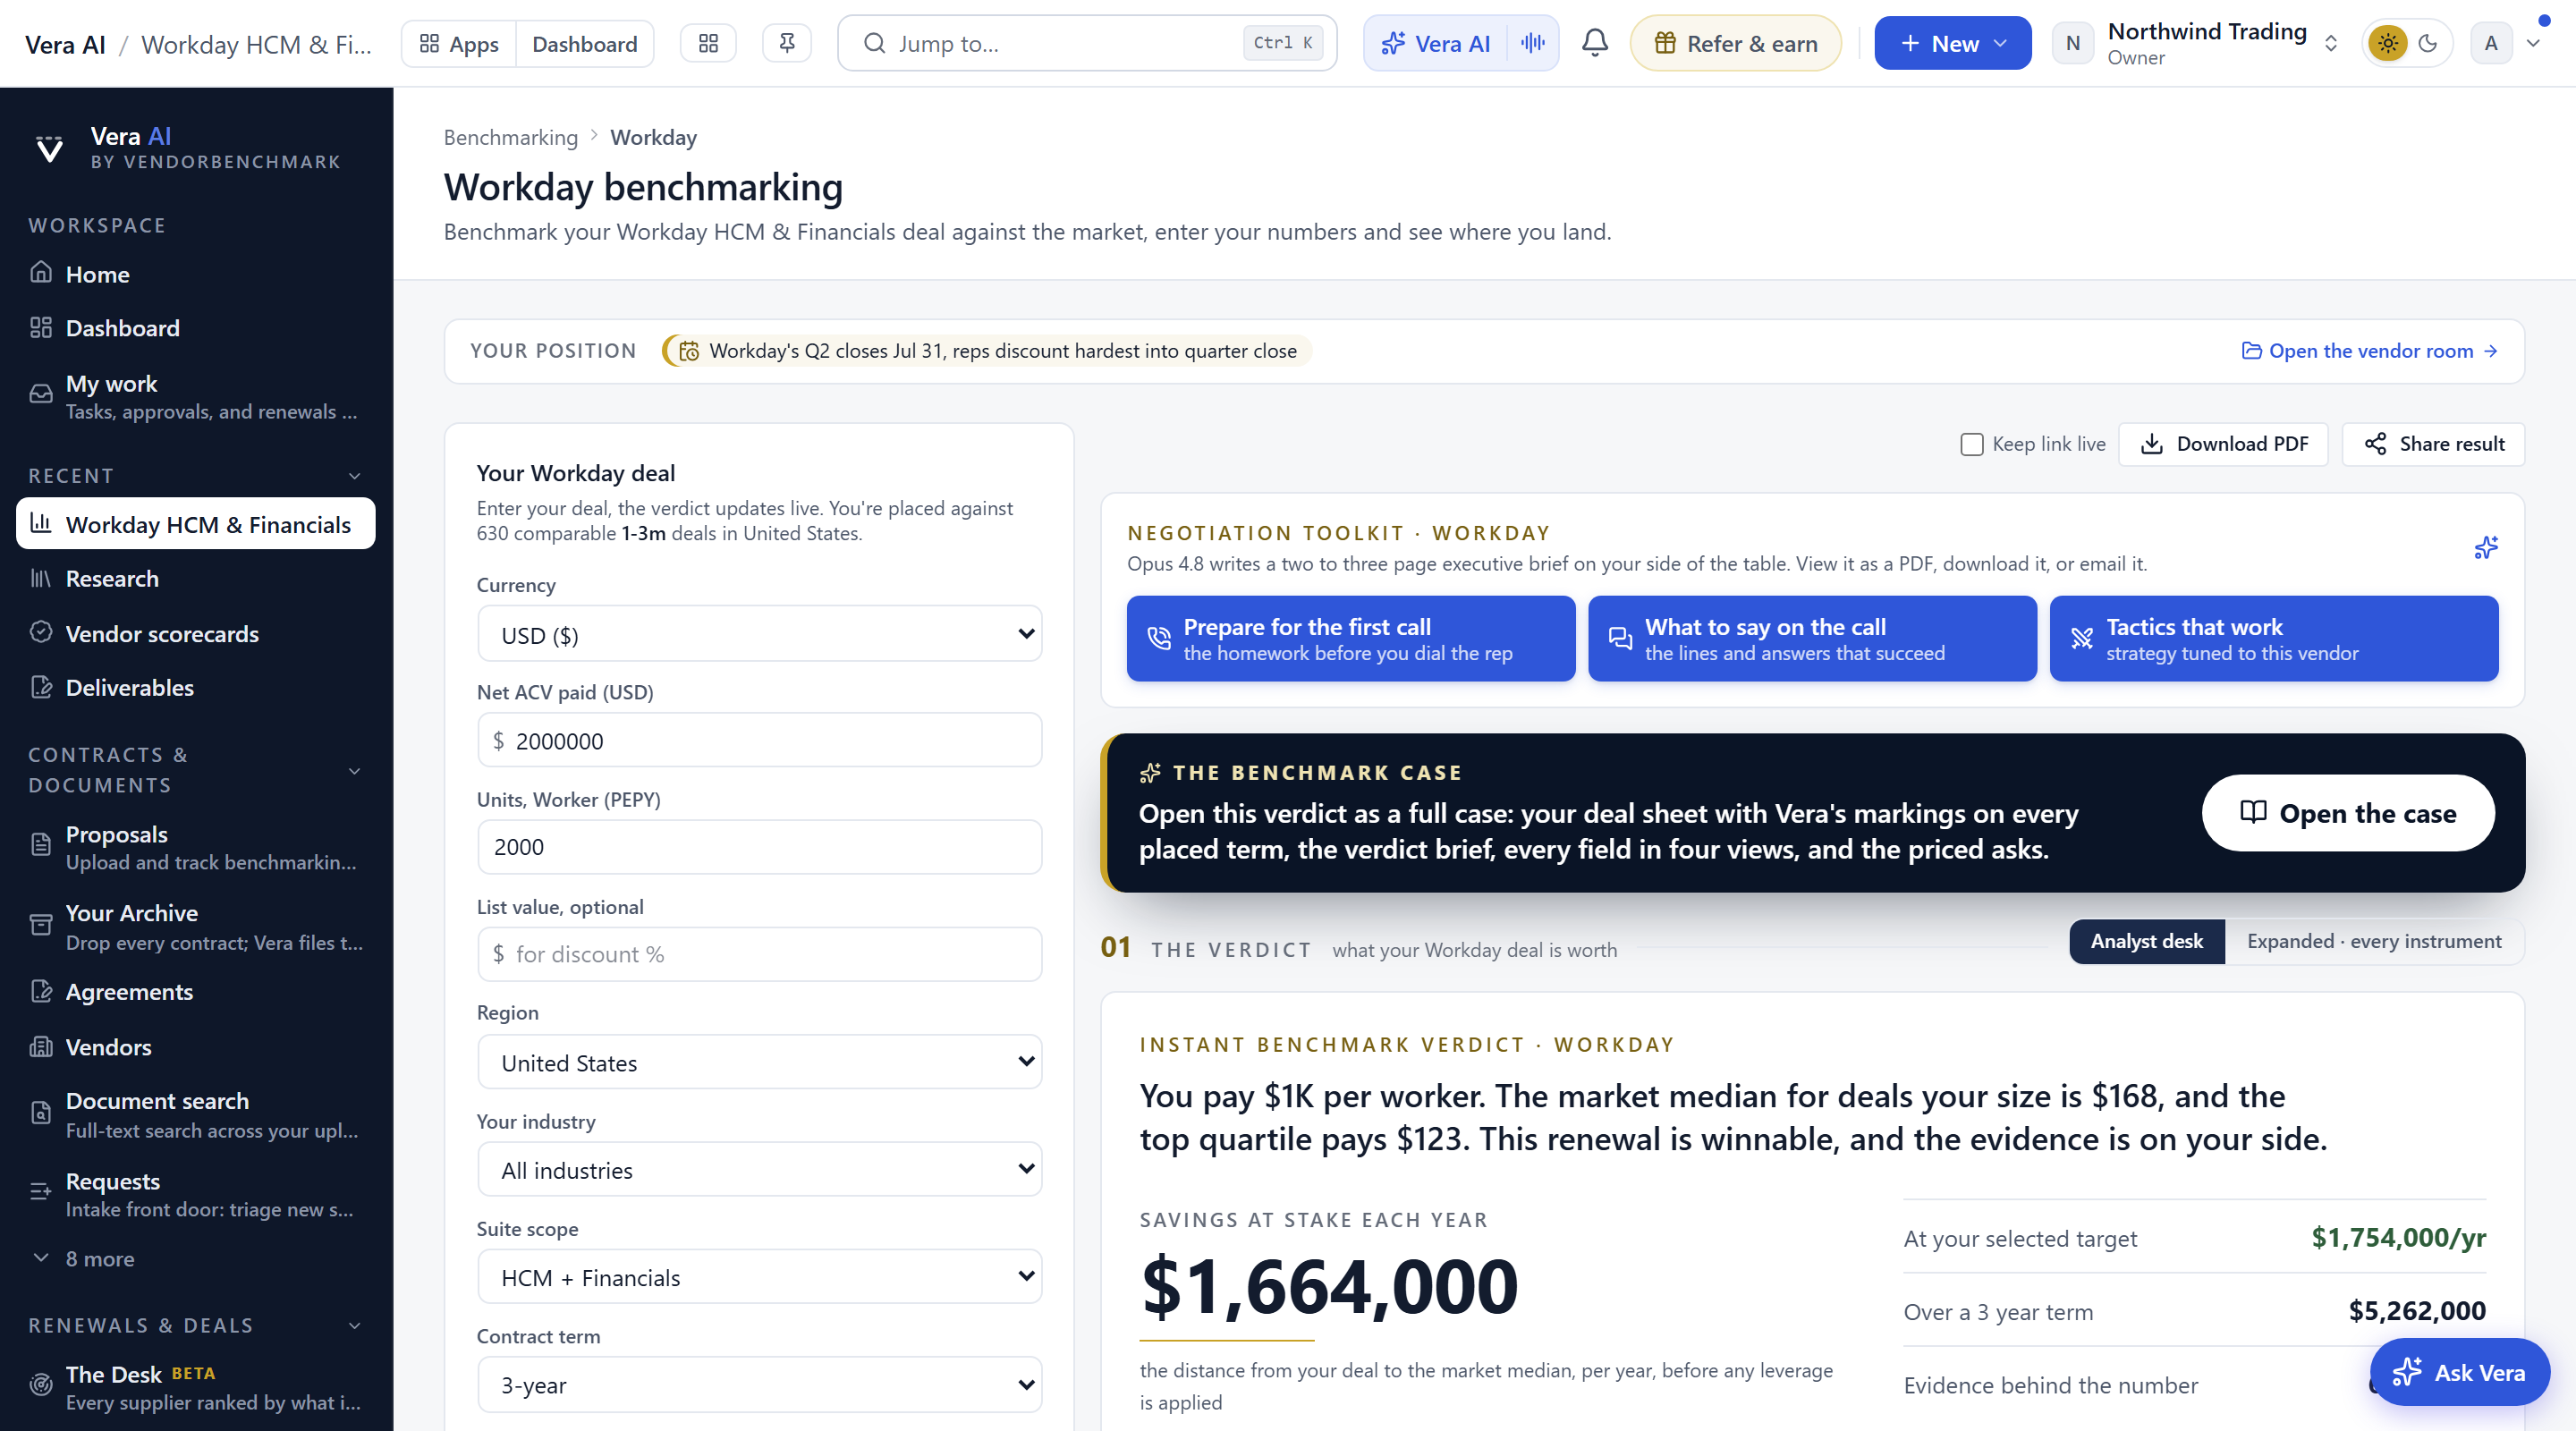
On the screen
- The window — the advanced view opens as its own window, the same dress the Benchmark Library wears, rather than as a page inside the workspace. The titlebar names the vendor, the product line and the view, and Back to the benchmark under the heading returns you to the sheet. The rail on the left lists that vendor's other product lines, so you can move from Nonprofit Cloud to Sales Cloud to Tableau without going back to the shelf, with the Benchmark Library, the Portfolio benchmark and Vendor Intelligence under them and a short summary of what the figures rest on at the foot. The sun and moon flips the workspace between light and dark, and the × or Esc closes the window and returns you to the library.
- The curve dock — on vendors covered by an August 2026 curve document (SAP, SAP Ariba, SAP Concur, SAP SuccessFactors, IBM, Microsoft EA, Workday, ServiceNow, the Oracle applications estates of E-Business Suite, JD Edwards, Siebel, PeopleSoft and Hyperion, Oracle Java SE, Oracle Fusion Cloud SaaS across ERP and SCM, HCM, EPM and CX, NetSuite, Salesforce across the core clouds, Marketing and Data Cloud, Agentforce, Tableau, MuleSoft and Slack, Google Workspace and Google Cloud with BigQuery and Gemini, AWS EDP, Adobe across Creative Cloud, Acrobat and Experience Cloud, Atlassian, Docusign, Zoom, CrowdStrike, Palo Alto Networks, Databricks, Snowflake, Informatica, Okta, Coupa, Veeam and the backup platforms Rubrik, Cohesity and Commvault, Autodesk, Datadog, Twilio, Citrix, Cloudflare, the contact center trio of Genesys, NICE CXone and Five9, Check Point, F5, Akamai, BMC, OpenText, IFS, Infor, SAS, Qlik, Alteryx, OneStream, Anaplan, Celonis, UiPath, Pegasystems, Procore, Epicor, Deltek, Tyler Technologies, Palantir, Freshworks, HubSpot, Sprinklr, Sage, Zendesk, UKG and ADP, Teradata, Nutanix, Wiz, CyberArk, SentinelOne, Zscaler, MongoDB Atlas, Confluent, Elastic, GitLab, JFrog, TIBCO, Boomi, Gong, Box, MuleSoft on its own vCore document, the financial services platforms FIS, Guidewire and Temenos, the market data desks Bloomberg, FactSet, LSEG, S&P Global Capital IQ and Moody's Analytics, the healthcare records vendors Epic, Oracle Health and Veeva, and the experience management pair Medallia and Qualtrics, and the finance and legal platforms Kyriba, BlackLine, Workiva, Vertex, Avalara, Ironclad and Icertis CLM, iManage, Relativity, LexisNexis and Thomson Reuters Westlaw, the collaboration, security and mid market ERP platforms Notion, Miro, Figma, Fortinet, Sophos, Darktrace, KnowBe4, QAD, Acumatica and Unit4, the Cisco estate re benchmarked across hardware and the Enterprise Agreement with Meraki, Webex and Splunk beside them, the information and data platforms Nvidia AI Enterprise, Kaseya, ZoomInfo, Wolters Kluwer, CoStar, IQVIA, Gartner and LinkedIn, the PE owned tool portfolios Quest and One Identity, Flexera, Perforce and ConnectWise, the HR stack Deel, Paycom and Paylocity as one negotiation, iCIMS, Cornerstone and Dayforce, the GRC set AuditBoard, Diligent, Mitratech, Archer and NAVEX, the consolidators Precisely, Rocket Software, Progress, Aptean and the Constellation Software operating businesses, the PAM duopoly Delinea and BeyondTrust on one shared curve, the security mid tier Ivanti, Tenable, Barracuda and Mimecast, the healthcare operations set Meditech, Waystar, R1 RCM and symplr, the education pair PowerSchool and Ellucian on one shared curve, the property manager RealPage with the DOJ settlement repricing line, the AP automation pairs Tipalti and BILL by monthly payment volume and Basware by annual invoice volume, the procurement challenger JAGGAER, the subscription billing vendor Zuora, the legal drafting roll up Litera, the insurance pair Duck Creek and Applied Systems on one shared curve, the ambulatory EHR pair athenahealth and NextGen by practice size, the nonprofit platform Blackbaud, the AEC conversion pair Nemetschek and Bluebeam on one seat banded curve against the December 2026 Revu deadline, Trimble with its published 40 to 80 percent trade in tiers shown as a reference line, and the Hexagon divisions, the insurance utility Verisk negotiated per layer, the data stack Domo, dbt Labs and Fivetran, the Equifax Work Number met with the verification waterfall, the BI challengers Sigma and ThoughtSpot on one shared displacement curve, and the developer tools set Snyk, Dun & Bradstreet, Docker, GitHub with Copilot and Advanced Security priced as one negotiation on both the GitHub and Copilot tools, HashiCorp, Redis, Postman and JetBrains, the library’s buyer friendly counter example whose nearly flat curve is the honest reading of a transparent vendor, MSCI with the fund launch basis point line beside the contested Analytics and ESG curve, Clarivate against its documented mandatory uplift posture, Ideagen in the revalidation moat’s consolidation window, Conga anchored at its documented 36 to 59 percent list to landed gap, Nintex on the workflow count meter, Hyland against its own public OMNIA pricelist, Morningstar and PitchBook on one shared curve negotiated with the vendor’s own investor relations statements, the observability pipeline Cribl by daily data processed, RingCentral by seats in the deflating UCaaS market, Sumo Logic by daily ingest with its printed renewal uplift struck at signature, PagerDuty and its add on ladder, Shopify Plus by annual GMV against the unpublished revenue share conversion, the travel and expense set Navan and Emburse, the interchange pair Brex and Ramp by annual card volume, and the consumption storage pair Pure Storage and NetApp by committed capacity, the supply chain set SPS Commerce by trading partners, E2open, the planning duopoly Kinaxis and o9 on one shared curve, Manhattan Associates and Blue Yonder, six ERP curves re benchmarked on annual contract value, NetSuite, Deltek, IFS, Epicor, Infor and OpenText, the core banking pair Fiserv and Jack Henry on one shared curve, Oracle MySQL by subscribed servers, the proxy advisory duopoly ISS and Glass Lewis on one shared curve, Nasdaq Adenza, Broadridge's unregulated services layer, nCino, and the open source repricing set: SUSE benchmarked by deal posture, Red Hat with its estate engineering line, MongoDB re benchmarked on its documented commit bands, Azul by Java server estate with the metric negotiated before the price, Grafana Labs with the OSS self host path as the structural leverage, GitLab in the Ultimate and Duo era with three meters on one developer, the revenue stack pairs Outreach and Salesloft, Gong and Clari, and Braze and Iterable each on its own documented line, Yardi completing the property duopoly by portfolio units, Jamf by managed devices against the Intune shadow, Intercom and Fin by monthly resolutions on the purest per outcome AI meter, the governance duopoly Collibra and Alation, Workato at its documented 35 to 50 percent list to landed gap, and the superseded Informatica and MuleSoft calibrations re benchmarked onto the IPU and Salesforce estate era, the industrial token meters AspenTech and AVEVA, the password duopoly 1Password and LastPass on one shared curve, and Akamai, Wiz, Medallia and F5 re benchmarked on annual contract value, and the wave twenty seven money meters: Stripe by annual card volume with the Adyen counter quote as the upper line, Adyen by processing volume with the 0.60 percent markup as the only line that negotiates, Experian and TransUnion on one shared bureau curve by annual pull volume with the 2026 FICO repricing and the VantageScore counter in the file, LexisNexis Risk Solutions by transaction volume split between the contested identity lines and the claims data monopoly, the publishing duopoly Springer Nature and Elsevier priced against the published DEAL benchmark and the documented UC, SUNY and DEAL exits, Plaid on the per login item meter with dormancy hygiene as the free discount, MathWorks with the toolbox prerequisite chain audit, Cotality decomposed per dataset under PE ownership, ICE Mortgage Technology by annual loan volume with the FTC mandated alternatives, Addepar by assets on platform against its documented rival gaps, Clearwater Analytics by assets under administration where the breakpoint schedule is the negotiation, SS&C on the per heritage roll up map, and the superseded SAS calibration re benchmarked onto contract value bands with renewal and migration event lines, and the AI coding tools, Cursor, Windsurf, GitHub Copilot with its three purchasing pathways, Replit banded by monthly agent spend, v0 by Vercel, and Lovable banded by monthly credits, and the wave twenty nine consolidation files: Verint and Calabrio on one agent count curve now that Calabrio operates inside Verint's platform, Seismic and Highspot on one seat curve carrying the two paddle era's transacted medians ahead of the February 2026 Permira merger, the enterprise low code tier of Appian, OutSystems and Mendix on one curve with the Power Apps shadow as the structural frame, Everbridge by contact count where the roster is the meter, UserTesting on its credit bundle economics, Grammarly on the shadow IT to enterprise conversion, Canva carrying the reversed 2024 shock repricing and its referenceable Pricing Promise, Airtable with the 84 percent seat architecture case, and the superseded Box calibration re benchmarked onto the AI repricing era's wider seat bands, and the wave thirty AI model provider set on one shared set of contract value bands: Microsoft 365 Copilot against its documented $18 to 22 landed band, Google Gemini and Vertex AI as one Google AI estate with the deepest curve in the provider set (the Gemini tool moves off the Workspace family onto its own curve), xAI Grok as the youngest and most volatile paper in the library, Perplexity with its 8x tier gap read as a negotiation signal, Cohere where the deployment tier decision moves costs 10x before any rate conversation, and Mistral AI whose own open weights cap its managed pricing, and the wave thirty one addition Abridge, ambient clinical documentation for health systems, banded by licensed clinicians and measured against the initial quote because the vendor publishes no list price at all), a panel above the tool where you choose the commercial model or product (for SAP: RISE Base, RISE Premium, BTP CPEA, BTP BTPEA, GROW, or the on premises reference; for Oracle Java: the standard line or the documented OpenJDK exit line; for Salesforce: the core clouds, the multi cloud commitment, or the flat renewal line) and the deal size band, and type the discount you are offered. The bands follow how each vendor actually prices: contract value for most, seat counts for Adobe Creative Cloud, Zoom, Google Workspace, GitLab, Gong and Box, protected endpoints for CrowdStrike and SentinelOne, protected workloads for Veeam and Wiz, protected capacity in TB for Rubrik, Cohesity and Commvault, agent counts for the contact center platforms, construction volume for Procore, user counts for Epicor and Deltek, platform fee for Palantir, privileged accounts for CyberArk, employee counts for UKG and ADP, production vCores for MuleSoft, hospital bed count for Epic, Oracle Health and Meditech, monthly claim volume for Waystar, net patient revenue for R1 RCM, annual verification volume for the Equifax Work Number, licensed seats for Sigma and ThoughtSpot, trading partner connections for SPS Commerce, subscribed servers for Oracle MySQL, licensed user count for Veeva, transaction volume for Vertex and Avalara, seat counts for Notion, Miro and Figma, licensed seats for ZoomInfo, workers on platform for Deel, employee headcount for Paycom, Paylocity, iCIMS, Cornerstone and Dayforce, monthly invoice and payment volume for Tipalti and BILL, annual invoice volume for Basware, practice size in providers for athenahealth and NextGen, user counts for BlackLine, QAD, Unit4 and Aptean, annual committed spend for AWS, Databricks, Snowflake and MongoDB Atlas, committed spend per contract year for the Google Cloud private pricing agreement, whose bands run from under $5m to $60m a year and whose curve keeps deepening at the top instead of flattening, committed spend per contract year for the Anthropic API, whose cohort carries deals signed since the April 2026 seat unbundling only and whose corridor tops out near 20 percent however large the commitment, licensed seats for Nemetschek, Bluebeam and Trimble, daily data volume for Cribl and Sumo Logic, Java server estate for Azul, portfolio units for Yardi, managed devices for Jamf, monthly Fin resolutions for Intercom, annual GMV for Shopify Plus, annual card volume for Brex, Ramp and Stripe, annual processing volume for Adyen, annual pull volume for Experian and TransUnion, annual transaction volume for LexisNexis Risk Solutions, annual loan volume for ICE Mortgage Technology, assets on platform for Addepar, assets under administration for Clearwater Analytics, contact counts for Everbridge, agent counts for Verint and Calabrio, seat counts for Seismic, Highspot, Grammarly, Canva, Airtable and the re banded Box, committed capacity in TiB for Pure Storage and NetApp, seat counts for RingCentral, licensed clinicians for Abridge, years since migration for the Atlassian loyalty decay curve, and estate size for Citrix and TIBCO, the program's two uplift curves under Cloud Software Group: their docks read the renewal increase on your quote rather than a discount, lower is better, and the rank inverts accordingly. The athenahealth dock is the library’s first rate curve: it reads the negotiated percent of collections by practice size, lower is better like the uplift curves, and prices every point of the rate against your own annual collections. It answers the three questions in order: your discount, the p05 to p95 range comparable customers land with its midpoint, and the rank in words (Poor, Below market, At market, Good, or Top of the market), priced per year when you give the deal value. The full curve for the chosen product renders underneath, and the Microsoft and Google Workspace docks add a pricing era switch, covering the November 2025 removal of programmatic EA discounts and the January 2025 Gemini repricing.
- The verdict masthead — the page opens as a document, not a dashboard. A kicker names the verdict, a bold headline calls it in plain words (A good deal, A fair deal, You are paying above market, You are overpaying), two or three sentences state what you pay, the curve midpoint at your size, and what prepared buyers land, and a meta line records the product, the data month, and your cohort. A rank pill beside the kicker grades the deal in one of five words, Poor, Below market, At market, Good, or Top of the market, in a color that agrees with the headline. Under the thin rule sits the figure band: the money on the table at the ask (or your edge on the median when you are ahead), the supported ask, the curve midpoint, your deal size band, and the days to renewal once your date is set. When a read cannot be right, a claimed edge larger than the commitment itself, or a unit price far outside everything the cohort holds, the masthead says Check the inputs, names the suspect field, and the pill reads Unverified until the figures make sense. Vendors covered by a curve document close the chart with the curve guideline as its caption, two lines visible and the full text one press away.
- The market curve, with your deal on it — the hero chart. The median discount runs as a navy line across the deal size bands, the prepared buyer line runs dashed gold above it, and the middle of the market is the pale band between the quartiles. Your deal is the navy dot: drag it up to test an ask, drag it right to see what a larger commitment earns, and the form follows the dot, so the dot, the form, and every figure below stay one state. Arrow keys move it too. The gap bracket beside the dot prices the distance to the supported ask per year.
- Your deal panel — the inputs in the right rail: currency, your net fee, unit count, an optional list value for the discount reading, region, industry, and any deal-structure levers such as term length or competitive presence. The verdict updates live as you type. The unit is the one the vendor actually licenses, named on the page throughout: FUE for SAP S/4HANA and RISE, named users for SAP ECC, cores for VMware, consultant hours for a rate benchmark. When your workspace holds exactly one agreement for the tool's vendor, a line above the form offers its stored annual value and renewal date: one click fills the matching fields, everything stays editable, and sample data never prefills. The strike clock goes one step further and reads the renewal date from that agreement automatically when you have not set one, so the roadmap on your own vendors never opens empty.
- Product — where a vendor sells several product lines with genuinely different economics, a Product selector sits at the top of the form: OpenAI splits into API committed spend and ChatGPT Enterprise seats, Anthropic into the API and Claude Enterprise seats, Cisco into EA software, hardware off the Global Price List, Meraki, Webex, and Splunk, and the Broadcom estate into VCF, VVF, standalone vSphere subscriptions, and CA mainframe. Switching products opens that product's own calibrated dataset; it is never a filter on the current one.
- Deal size — a one-click way to read the market for a size before you have a quote. Picking a band (for example $250k to 1m) fills a typical net value for that size into the form; you can refine the exact figure at any time, and everything downstream updates as if you had typed it.
- The market discount curve — on every discount benchmark, a small table under the inputs shows the median discount and the typical range for each deal size band, your band highlighted in gold. Once your deal is entered, your own discount is placed inside your band's row, so the first read is always the three answers in order: what you are offered, what comparable customers get at your size, and where that ranks.
- Open the case — the navy band at the top of the results. It opens your placed verdict as a full screen benchmark case of four executive brief documents, every figure computed from your live position. Your deal sheet is two pages: the order form facsimile with Vera's markings and margin pins on every placed term (risk pins in brick), then a reading ledger (field, what the paper says, what it means for you, a verdict pill) and the deep dive panels on the clauses that decide the deal. The verdict brief runs three pages: the position summary, a commercial journey chart from list paper to your paper to the close target, a peer scatter drawn from the real cohort with your gold ringed dot called out, section by section verdict words (Ahead, At market, Behind, Exposed), a numbered How the target gets achieved sequence, a pull quote, and the bottom line. The field atlas shows all four instruments in sequence: the range bars, the percentile ladder with your YOU cell placed among the cohort's quantiles, the captured versus defended dollar stack whose totals reconcile with the verdict line, and the full verdict table. The ask sheet carries eight to ten sequenced asks (anchors first, protections second, the rate once the table is set, timing last), each with its clause anchor, its priced value, a Say this script line, and an If they push back counter. Press any figure, tag, or chip inside the case and it jumps to the exact clause the number was read from; Play the read walks the deal sheet one lit term at a time. The case recomposes from your live position every time you open it, levers included.
- The workroom dock and rail — the icon strip on the case's right edge and the finding blocks under the document list. Press ⚡ and the paper slides left to make room for the What now panel beside it, so you can read the verdict brief and fire the moves at the same time; press ✦ and the same split opens Ask Vera, grounded on the whole case, with one chip per document. Click a chip and the cited document opens on the stage. Questions asked here land in the same saved conversation every time you reopen this case. Esc unwinds one layer at a time: the open dock panel, then the open room, then the case. Below the document list the rail carries Find a case (search every vendor benchmark by name, recent cases first; a recent reopens with its case on the stage and your numbers prefilled, and a vendor you have not benchmarked yet lands on its page so you can enter your deal, because a case is only ever built on figures you supplied), a Research search over your own uploaded documents, and your shelf: the last benchmark cases you worked, under Recent and Starred tabs, each reopening its page with your numbers prefilled, plus a Star this workroom button for the open case.
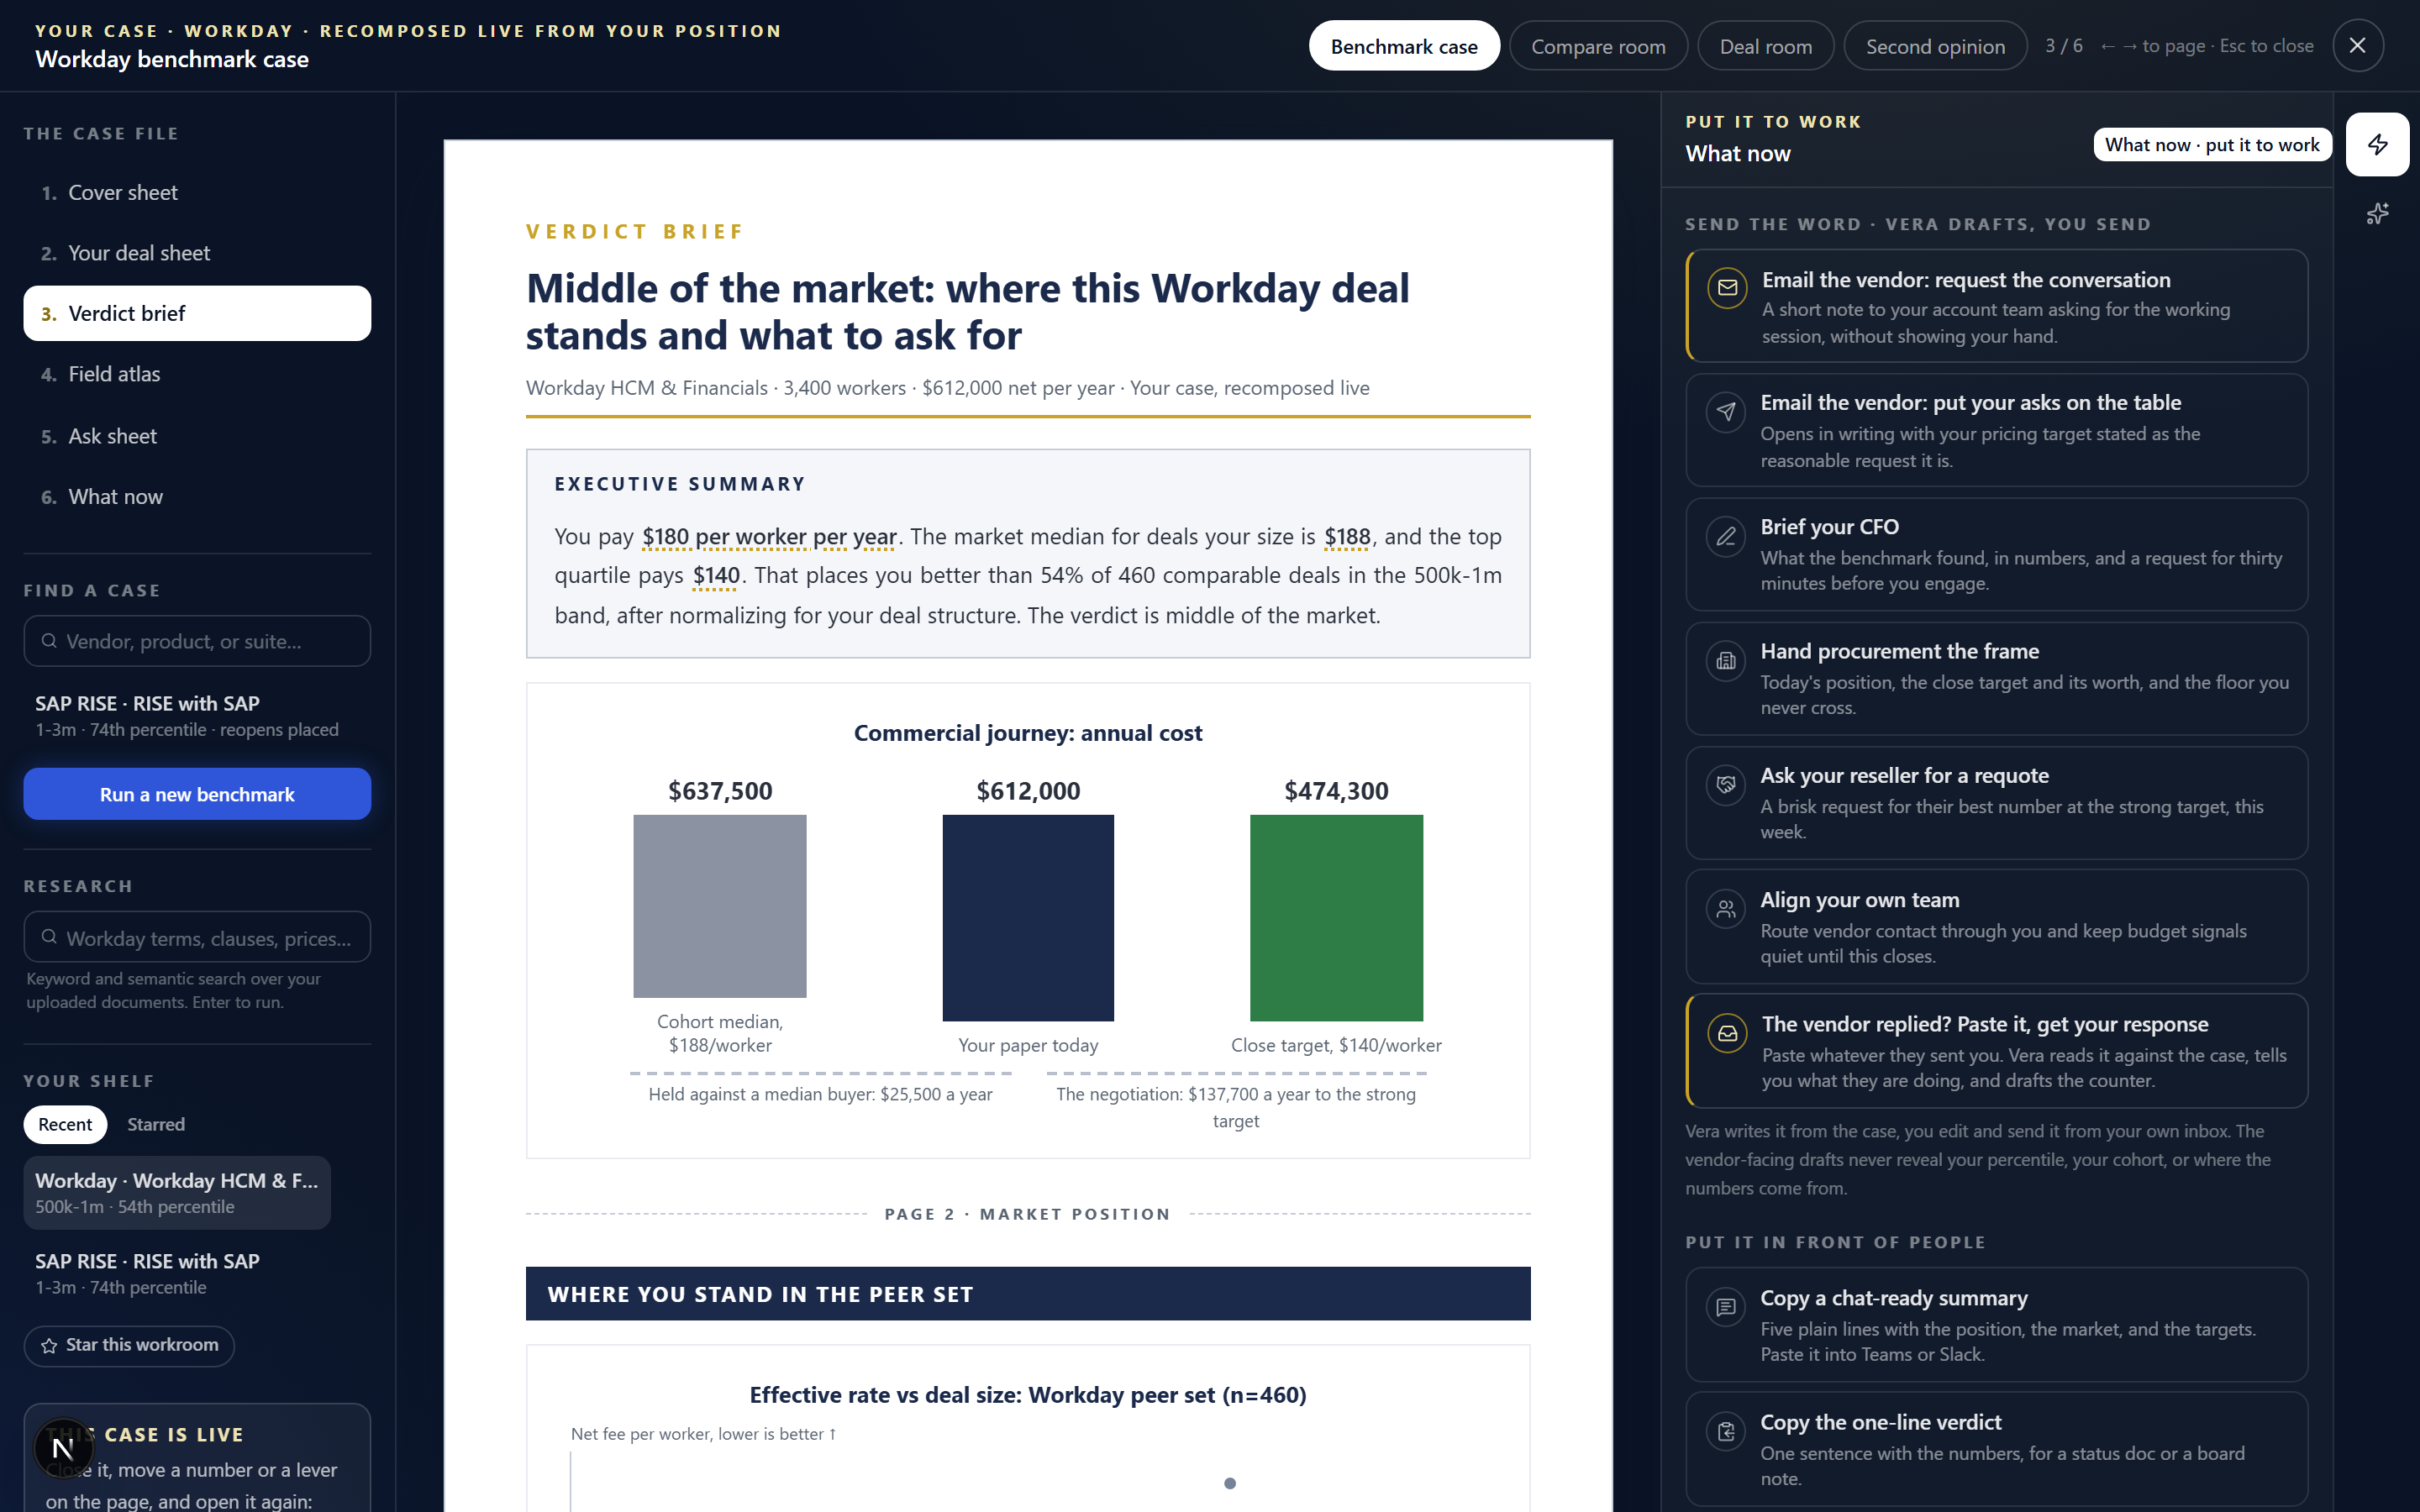
- The case rooms — the pills in the top band beside the case title: Benchmark case, Compare room, Deal room, Second opinion. They swap what is on the stage without closing the case. The chrome, the document rail, the dock and every figure stay where they are, so nothing is lost and the way back is the Benchmark case pill, any document in the rail, the back button at the foot of the room, or Esc. On a narrow window the same pills ride the end of the document strip.
- Compare room (in the case) — your saved positions for this vendor, listed newest first. Tick up to three and press Replay them together: each one is replayed alongside the position on the page now, through the same peer-cohort math against today's data rather than the standing stored at save time. You get the scenario verdict (which position is strongest, the gap in discount points or fee per unit, and what that gap is worth per year at your volume), a standing band with every position dotted on it and the strongest in gold, and the table underneath: metric value, standing, cohort median, top-quartile target, annual headroom to median, and the save date. With no saved positions yet, the room offers to save the one on the page so the next quote has something to land against.
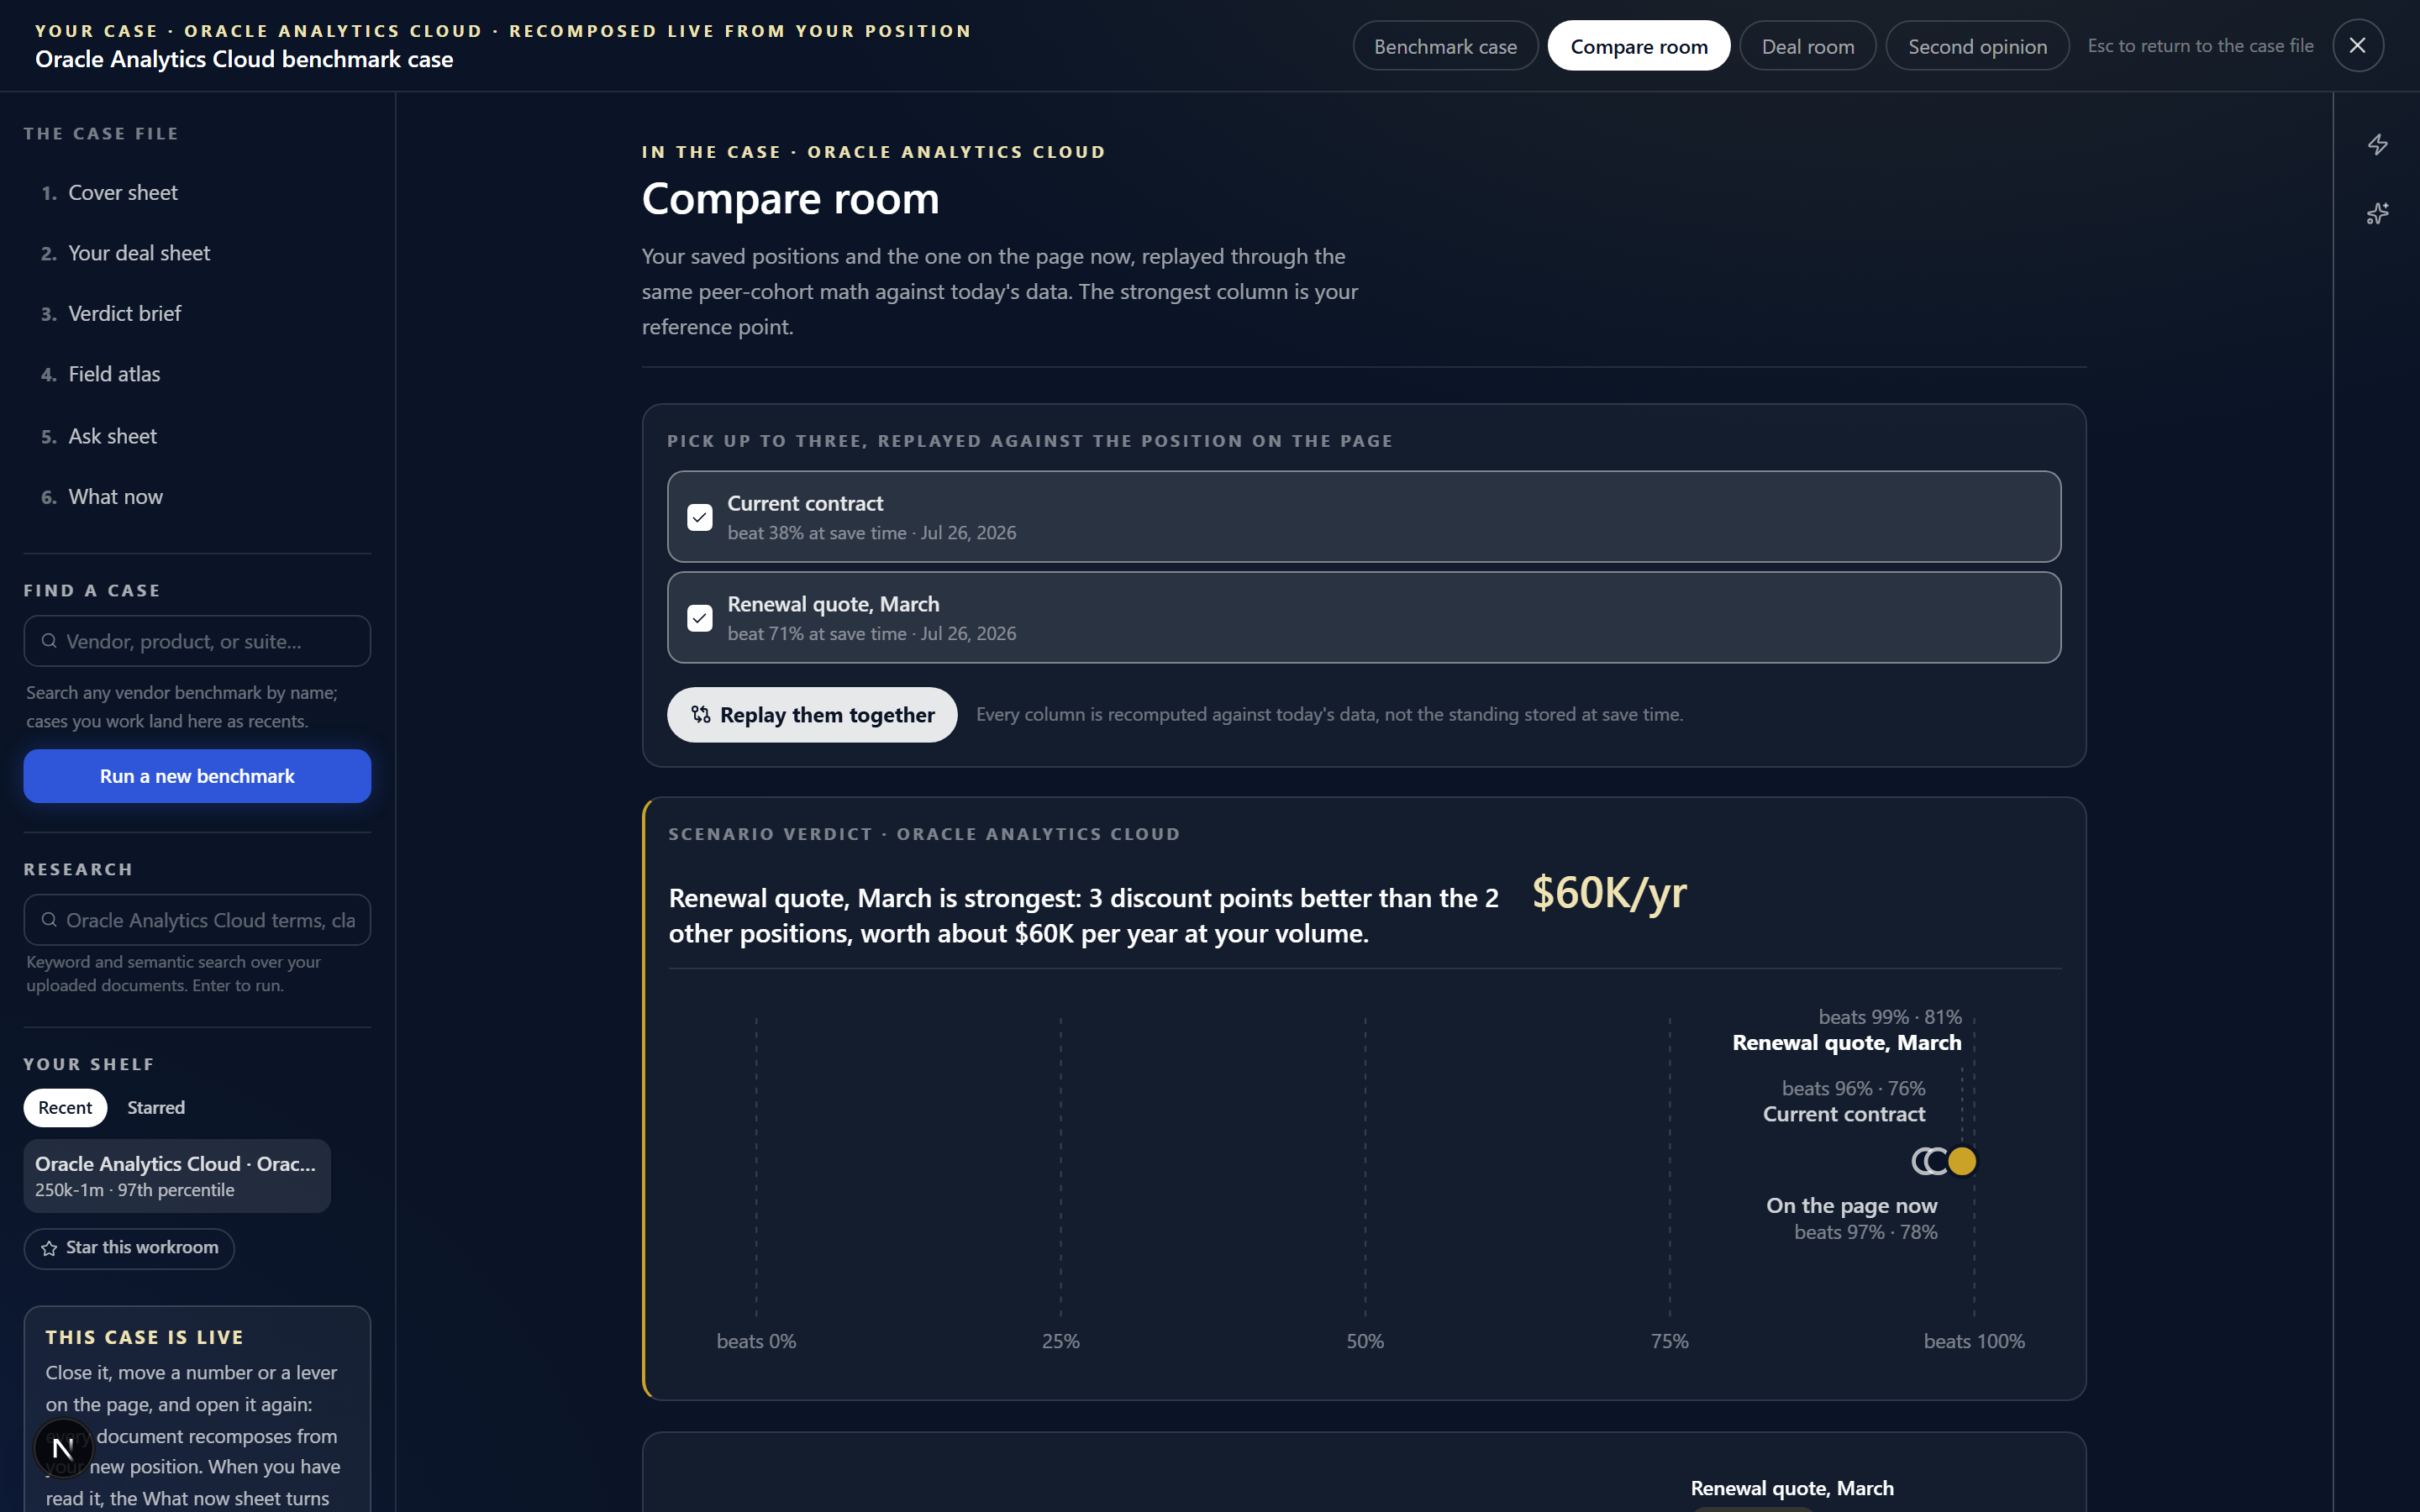
- Deal room (in the case) — what the Vera Deal-Room adds to this benchmark: it reads the contract itself and assembles the decode, the vendor intel, a credible alternative, the brief and the playbook around it. Below that sit your existing deal rooms, this vendor's first and flagged, each opening at its own stage, and one control to hand in a contract and start a new one.
- Second opinion (in the case) — the same shape for the four page verdict brief: what a second opinion adds to this benchmark, your existing opinions with their verdict lines and this vendor's first, and one control to run a new one. Both of these read a contract and take a few minutes, so they run as their own jobs; this case stays on your shelf, one click from where you left it.
- What now — the case file's sixth document, and the answer to "what do I do next with this benchmark?". The same moves also ride the ⚡ dock panel beside every page of the case. Twenty plus moves in five families, every one running on the case's own numbers. Send the word: Vera drafts six emails you edit and send from your own inbox, to the vendor account team (opening the negotiation, or putting your asks on the table), your CFO, procurement, your reseller, and your own team; the vendor facing drafts never reveal your percentile, your cohort, or where the numbers come from. Every draft is written against what is known about how that particular publisher negotiates, where it concedes, and where its fiscal year sits, so an Oracle email and a Salesforce email do not read the same. Put it in front of people: copy a chat ready summary or the one line verdict, mint a 30 day share link that recomputes as the market moves, or copy a prefilled page link for a workspace colleague. Turn it into paper: generate the three negotiation toolkit briefs as executive brief PDFs, or download the one page position snapshot. A brief is written from scratch against your position and takes about three minutes, so the move shows a progress meter with the seconds elapsed and the usual duration while it works; the estimate tightens against your own past runs, and you can keep reading the case while it finishes. Keep it working: save the position as a named scenario, with or without market alerts, set the renewal date, or jump back to the levers. Go deeper: Ask Vera with the case loaded as the question, compare vendors side by side, open a full negotiation workup, or book an analyst review with the agenda prefilled.
- The research shelf — the reading closes with what stands behind the vendor, live on the platform: documents from the research library and analyst briefings, each card opening the real thing in the app. Only those two sources appear here, and the count links to the vendor's shelf at /research.
- The email desk — what opens when you pick one of the six drafts. Three controls sit around the draft. The angle is a row of buttons across the top: the reason the email is making its case. The vendor facing drafts offer competitive pressure (the default, which names an alternative you could credibly move to, says the price is above market for a customer your size, and asks for a competitive offer before you go further), budget pressure (the line is capped and today's number does not fit, no alternative named and no target stated), and market price (you know what this goes for at your size and the next term has to reflect it). The internal drafts have their own three: your CFO email can ask for the decision, lead with the money, or lead with the risk of renewing untouched; procurement can take the frame, the money, or the timing; your team note can route contact through you, be a light heads up, or ask for the usage evidence. Pressing an angle rewrites the whole email around that premise. Ask Vera for a rewrite is the field under the draft: say what to change in your own words ("shorter and firmer", "name our March renewal", "drop the last paragraph") and she rewrites what is on screen, so edits you already made by hand survive; leave it empty for a fresh take on the same angle. The alternative named in a competitive draft is researched rather than assumed, from your own alternatives analysis when you have one and a live search when you do not, and when nothing can be verified the email refers to your alternatives in general terms rather than naming a company. Nothing sends from here; you copy it or open it in your own email app.
- The conversation log — under every vendor facing draft: save this email and it becomes the opening move on a negotiation track for that vendor, which is where their reply will land. If a track is already open the panel says how many messages are on it and the draft files onto the same thread rather than starting a second one. Closing the window with an unsaved draft asks once before it lets the ask go. When they answer, paste their reply into the counter desk (The vendor replied? Paste it, get your response): Vera reads the message against your position *and* against everything already on the log, so a number they are quietly repeating or a concession they are walking back is visible, then tells you what the account team is doing, what to hold, and drafts the response, which never reveals your percentile, your cohort, or where the numbers come from. Save it to the log keeps the whole round: their message, your response, and her read of it. The conversation log move opens the tracks themselves. If you would rather work the thread from your own inbox, the desk links to the ghost writer, where you forward vendor mail to a private agent address instead of pasting.
- Where this lands — a percentile band pinned under the inputs showing the middle 50% of your peer set with your deal marked, and the verdict pill (favorable, mid, or above market).
- The brief — a placed deal reads as a five chapter decision brief. 01 The verdict: the document masthead opens with the plain call in one colored line and a one-sentence reading, then the judgment sentence, the stat band, and the market curve carrying your deal as a draggable point; drag the dot and the form follows. Beneath it, the recommendation: the play in one bold line followed by the moves as a short numbered list, all written from the same targets and clock every instrument runs on, then Ask Vera and the Take it forward console side by side. 02 The ask, when the market holds better deals than yours: the three targets (defensible floor, strong close, stretch anchor), each priced from the cohort. When your deal is ahead of the market the chapter becomes The protection instead: the 3 year cost of your commitment under a typical 8 percent uplift against a written 5 or 3 percent cap, priced in dollars, because a buyer who beats the market should never be handed repair targets worse than the rate they hold. 03 Timing and the plan: the engagement roadmap, one card that opens with the four numbers on the clock (the vendor's quarter close, the open window, your notice deadline, and the renewal, each with its days remaining), then three phase lanes (prepare, engage, paper it) on a month ruled time axis with every deadline dropped through the lanes, and closes with the three moves in the same phase colors, each composed from your own figures. 04 The research: the library documents and analyst briefings standing behind the vendor. 05 The working file door. Every instrument carries a short "what this is, how to read it" note, and hovering any figure offers an enlarged view with the same reading.
- The brief and the working file — the toggle beside the verdict chapter. The brief (the default) is the ninety second read above. The working file restores the field (every comparable deal as a dot, with the list value dial on discount benchmarks) and the deal snapshot table between the verdict and the ask, and adds every remaining instrument at the end of the page: the peer comparison suite, the deal played forward, region and signing-year medians, the deal-structure levers, the savings bridge, the should-cost waterfall, your leverage scorecard, the pushback counters, and the scenario theatre where you drag seats, term, and price and the totals reflow. The working file only adds; nothing in the brief changes.
- Saved scenarios — name a position and save it to track it over time, feed the Portfolio benchmark roll-up, and get alerted when that vendor's market moves. Two or more saved positions on the same tool compare side by side on one standing band. Comparison is per tool: a Microsoft EA position and an Oracle ULA position are measured on different metrics and are never placed on the same band.
- The five flagship tools save the same way — Microsoft EA, Oracle ULA, Oracle Technology, Sales and Service Cloud, and Oracle Java SE each carry their own dataset and their own math, and each now carries the same Saved scenarios panel. Name the position, press Save, and it joins the roll-up like every other vendor. The figures are re-run on the server when you save, so a saved position is the tool's own math rather than a number a browser sent. Saving is only offered once the tool has placed your deal against a large enough peer cohort, and a workspace can hold up to 200 saved scenarios.
- The money still on the table — the flagship tools close on the annual gap between your position and the market median, then the moves that go after it: start the negotiation carrying these numbers, compare your saved positions, open the roll-up, open the vendor room, get a second opinion on the actual order form, copy the one line verdict, ask Vera what she would do, or book the analyst walkthrough.
- Action bar — download the placement as a PDF, or create a share link (valid 30 days, optionally kept live so it recomputes against current data each time it is opened).
How to use it
- Find your vendor from the shelf, the search box, or the Ctrl/⌘ K palette, and open it. The benchmark sheet is what opens; read the verdict there first.
- Press
a, or View, Advanced view, when you want the instruments: the levers, the comparison cut several ways, the case file, or the research behind the vendor. - Enter your deal on the left. The verdict, targets, and play light up as soon as your deal is placed against a deep enough cohort.
- Read the play and take the target and counters into the negotiation. Save the scenario or share the result with your team.
Tips
- When too few comparable deals match your position to rank it honestly, the page says so instead of showing a noisy percentile. Widen the region to all regions, or check the deal size.
- Pick your currency at the top of the deal panel and the whole page follows it: you enter euros or pounds and every figure on the page, in the case documents, and in the PDF export reads back in the same currency. The reference deals are held in US dollars and converted at a fixed rate, printed under the selector with the date it was set, so a saved position replays identically rather than drifting with a live feed.
- For vendors whose discount scales with deal size, such as Oracle cloud, your deal is ranked inside its own value tier, so a small deal is not judged against whale discounts and a large deal is held to the deeper discount its size should command.
- An instant check is a fast read you run yourself. For a full, hand-verified analysis of a specific quote or contract, upload it for analyst benchmarking; the vendor page links straight into the upload wizard with your vendor and deal value prefilled.
Related: Benchmark Library · Analyst Benchmark · Portfolio benchmark
Next: Chapter 03 · Tooling & playbooks
Was this page helpful?
Thank you. Your note goes straight to the team that writes this manual.