Enter what you pay. See where the deal ranks in minutes.
The Benchmark Library places your deal on the curve for its vendor and product line at your deal size, across 1,471 vendors, and answers three questions: what the deal costs, what comparable customers get, and where it ranks, from Poor to Top of the market. Not survey data, not list price math, not a vendor rep telling you what is typical.
The vendor knows exactly what every comparable company paid. You know what you paid last time. That asymmetry is the whole game, and it is why a rep can call a 12% discount generous when the market clears at 40%. Benchmarking closes the gap on your side of the table.
From a net price to a defensible position, in one sitting.
Four ways in, all reading the same library.
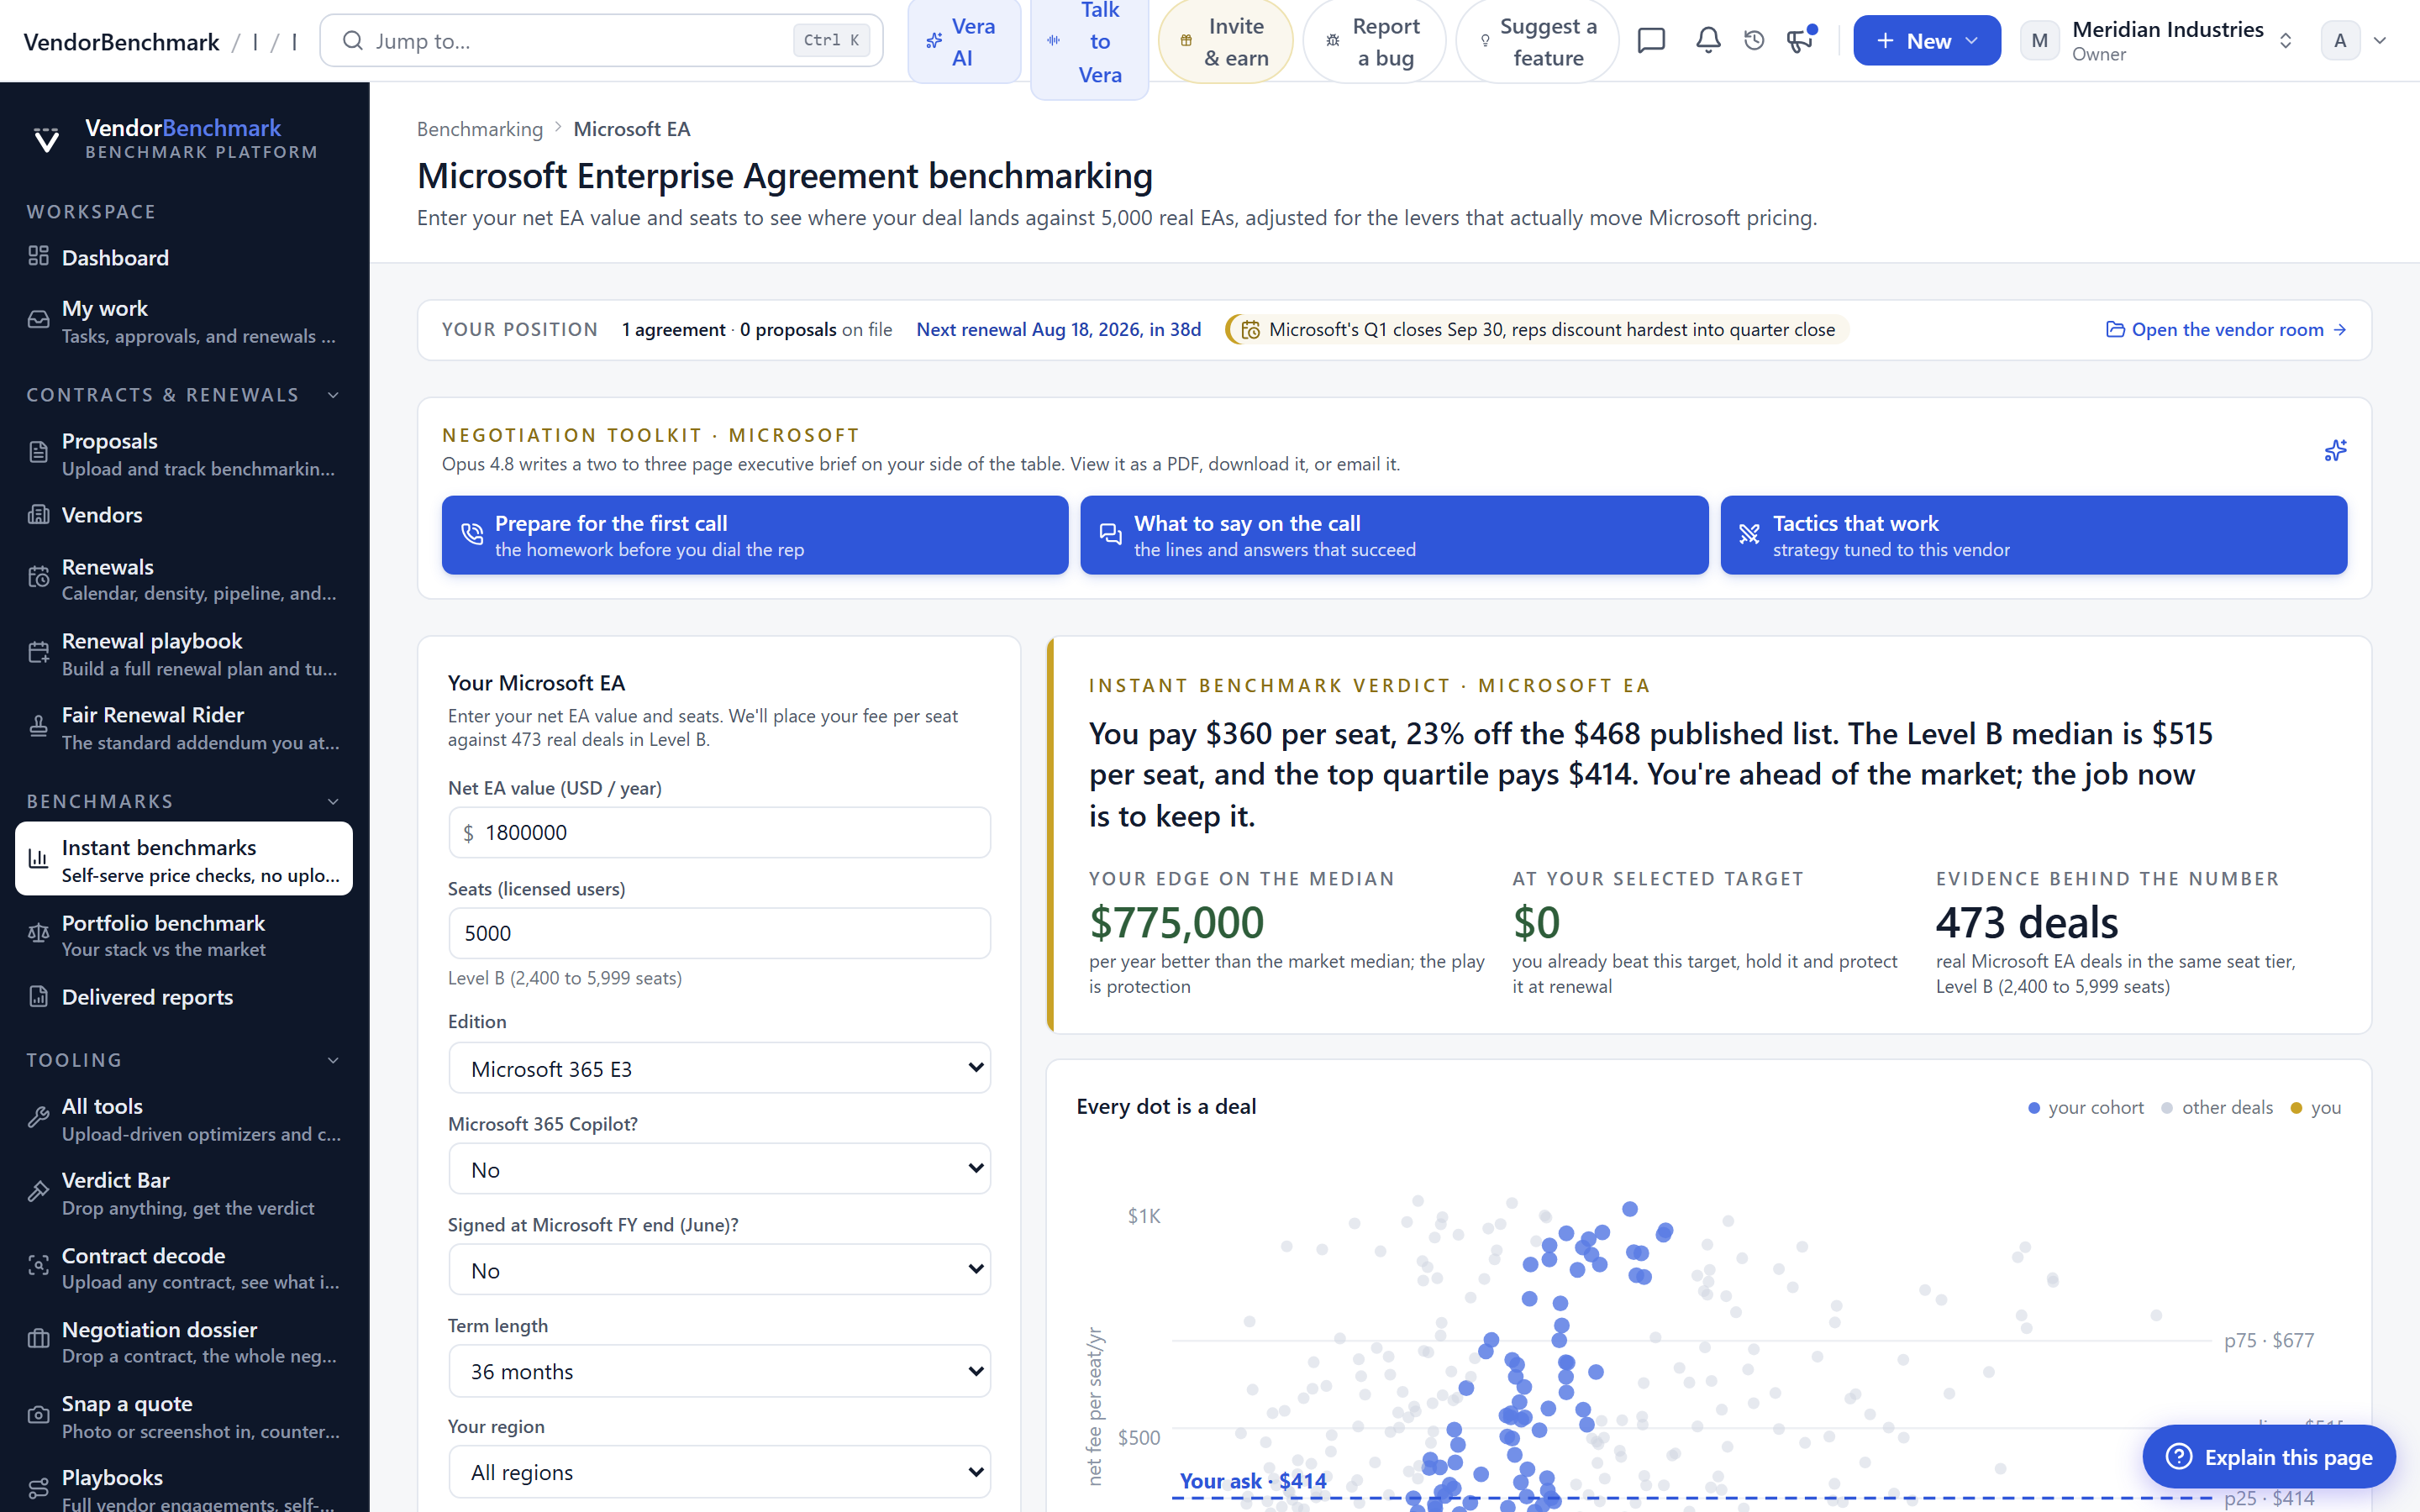
Pick the vendor, type the discount and what you pay a year, and the curve draws your deal and ranks it. No upload needed. Guided tools for Microsoft EA, Oracle ULA, Salesforce, SAP RISE, and other flagships handle their real pricing units.
Upload the quote, the order form or the contract, select what you need back, and a named VendorBenchmark analyst benchmarks it by hand within 24 hours: your standing, where to improve, the risks in the paper, and a clear target number.
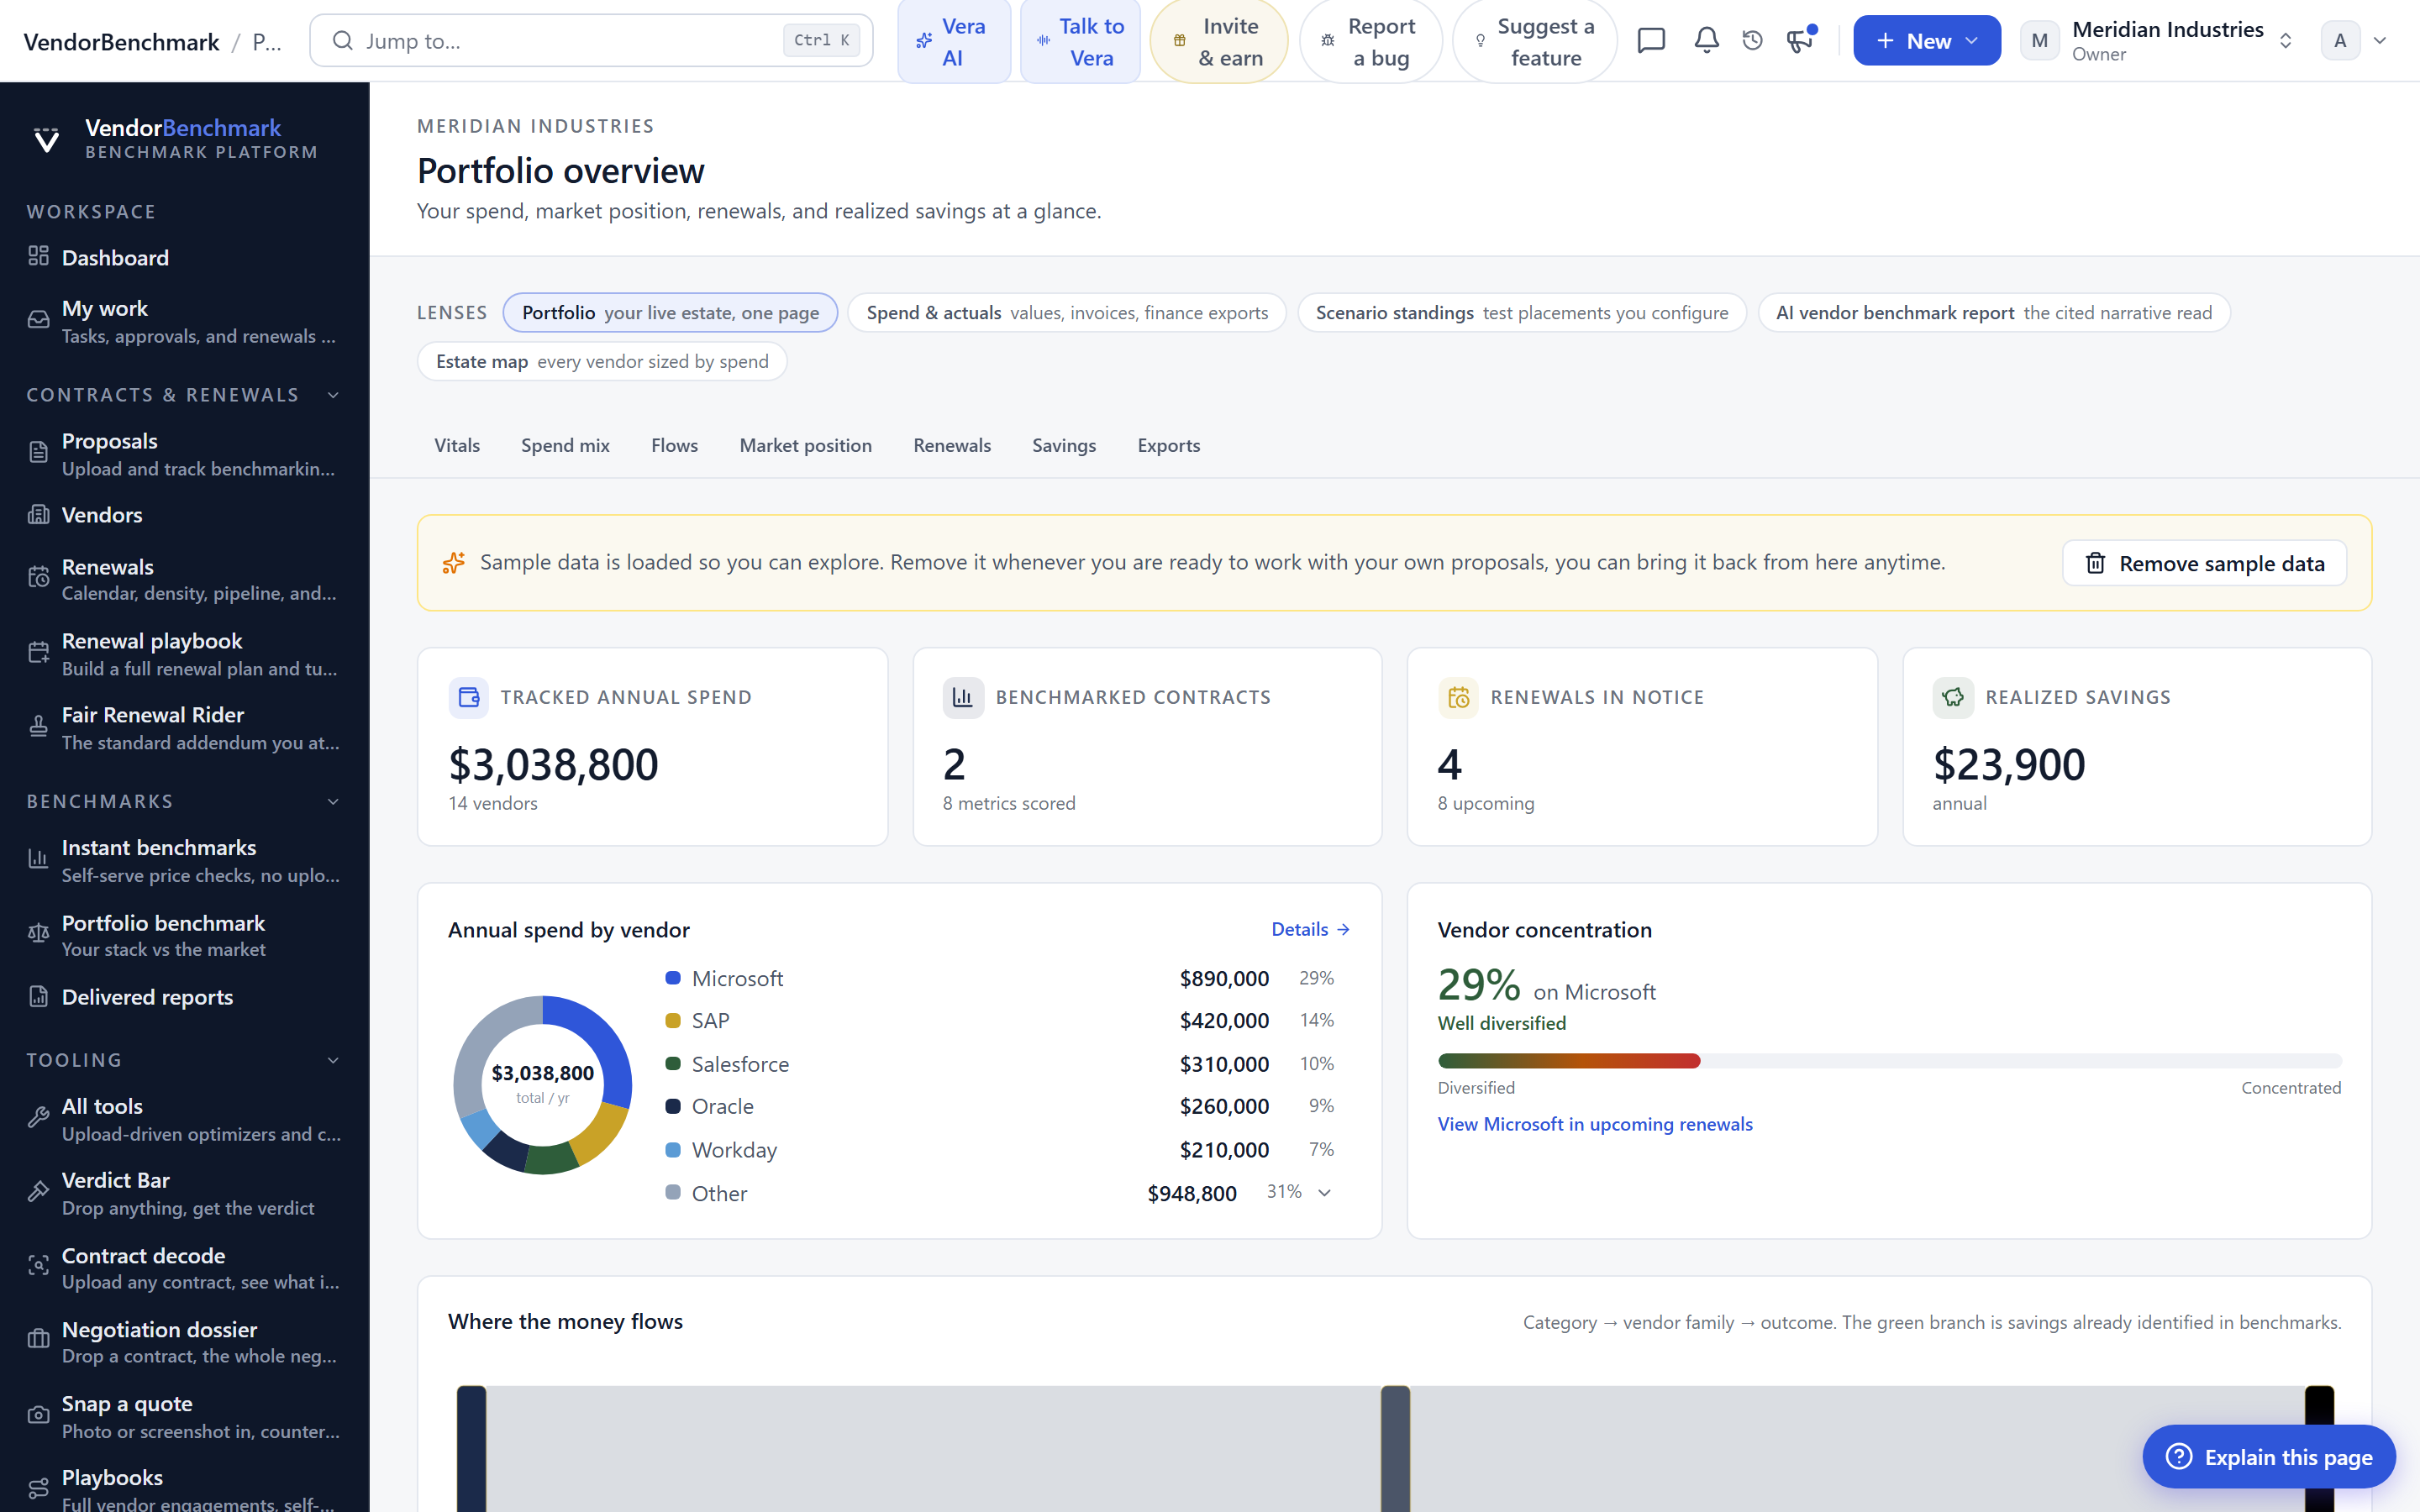
Every contract you hold benchmarked in one run: discount off list where the contract states a list, rate against rate where it does not, so you see which contracts fund your savings target, priced per year.
Move the term, the volume and the discount and watch the supported target move on the curve. The reads and reports, the brief, the deck and the email to the vendor, open from the same window.
The AI reads the deal. The cohort keeps it honest.
The rank is math on real data, never a guess. The AI sits on top: it reads your contract to pull the fields that make the comparison fair, writes the analyst-grade narrative around the number, and drafts the next move. Every figure it prints is grounded in stored data and citation-tagged.
A benchmark is only as good as what feeds it.
The number is defensible because of how the data underneath is built and governed.
Your rank is read off the curve for the same product at the same size, normalized for deal size, region, industry, and signing period, so a small mid-market deal is not benchmarked against a global enterprise agreement.
Contribute one anonymized outcome and unlock the realized uplift peers actually paid. Salted keys and a k=5 floor keep every contribution anonymous, and the metric is realized uplift, not a headline discount claim.
Contributed datapoints are graded by analysts before they influence the cohort, so one bad number cannot skew the market you are measured against.
A quarterly, versioned index with a public and keyed API, so you can reference a fixed, dated figure in a board paper without it shifting under you.
Your contracts and saved scenarios live behind Postgres row-level security, so your numbers feed your view and never leak into anyone else’s cohort or account.
The work a consultant bills a week for, before your coffee cools.
Sourcing comparables, normalizing them, and writing the standing up used to be a multi-day analyst engagement per vendor. Here it is a single self-serve run, and the write-up and the next email come with it.
Estimate your own hours →Not a survey, not a rate card, not a rep’s word.
The category is full of stale reports and anecdotes. The difference is the data and how live it stays.
A benchmark report priced two years ago, sold to everyone, and never adjusted for your size or timing is an anecdote in a PDF. Ours is read off the curve at your size and watched after you save it.
The classic engagement scopes one vendor, bills for the sourcing and the write-up, and ends when the invoice does. Here it is self-serve across 1,471 vendors, and the method is yours to re-run.
Discount-off-list calculators stop at a number the vendor controls. Your rank places that discount against the range comparable customers pay.
Business value, and the operational value under it.
One line for the board paper, and the day to day the team actually feels.
- A defensible target number for every renewal, grounded in the curve for that line rather than a hunch, so finance can sign off on the ask.
- Savings you can prove: the standing before, the position after, reconciled to the invoice later.
- A citable index figure for board papers and vendor emails that does not shift under you.
- Leverage on your side of the asymmetry the vendor has always enjoyed.
- A verdict in minutes instead of a multi-day analyst engagement per vendor.
- One place to save, compare, and re-run scenarios, with alerts when the market moves against a saved position.
- The benchmark hands straight off to a drafted email, a negotiation brief, or the savings plan, so nobody faces a blank page.
- The whole stack ranked by distance from market, so the team works the biggest headroom first.
Know the fair number before the vendor names theirs.
1,471 vendors. Three views. An analyst when you want one.