How to read a percentile: what "you are at P42" actually tells you.
The percentile is the most useful number a buyer can carry into a negotiation, and the most casually misread. What P42 actually says, the normalizations that make it mean anything, when a middling position is perfectly fine, and the four questions to ask any percentile before you spend negotiating capital on it.
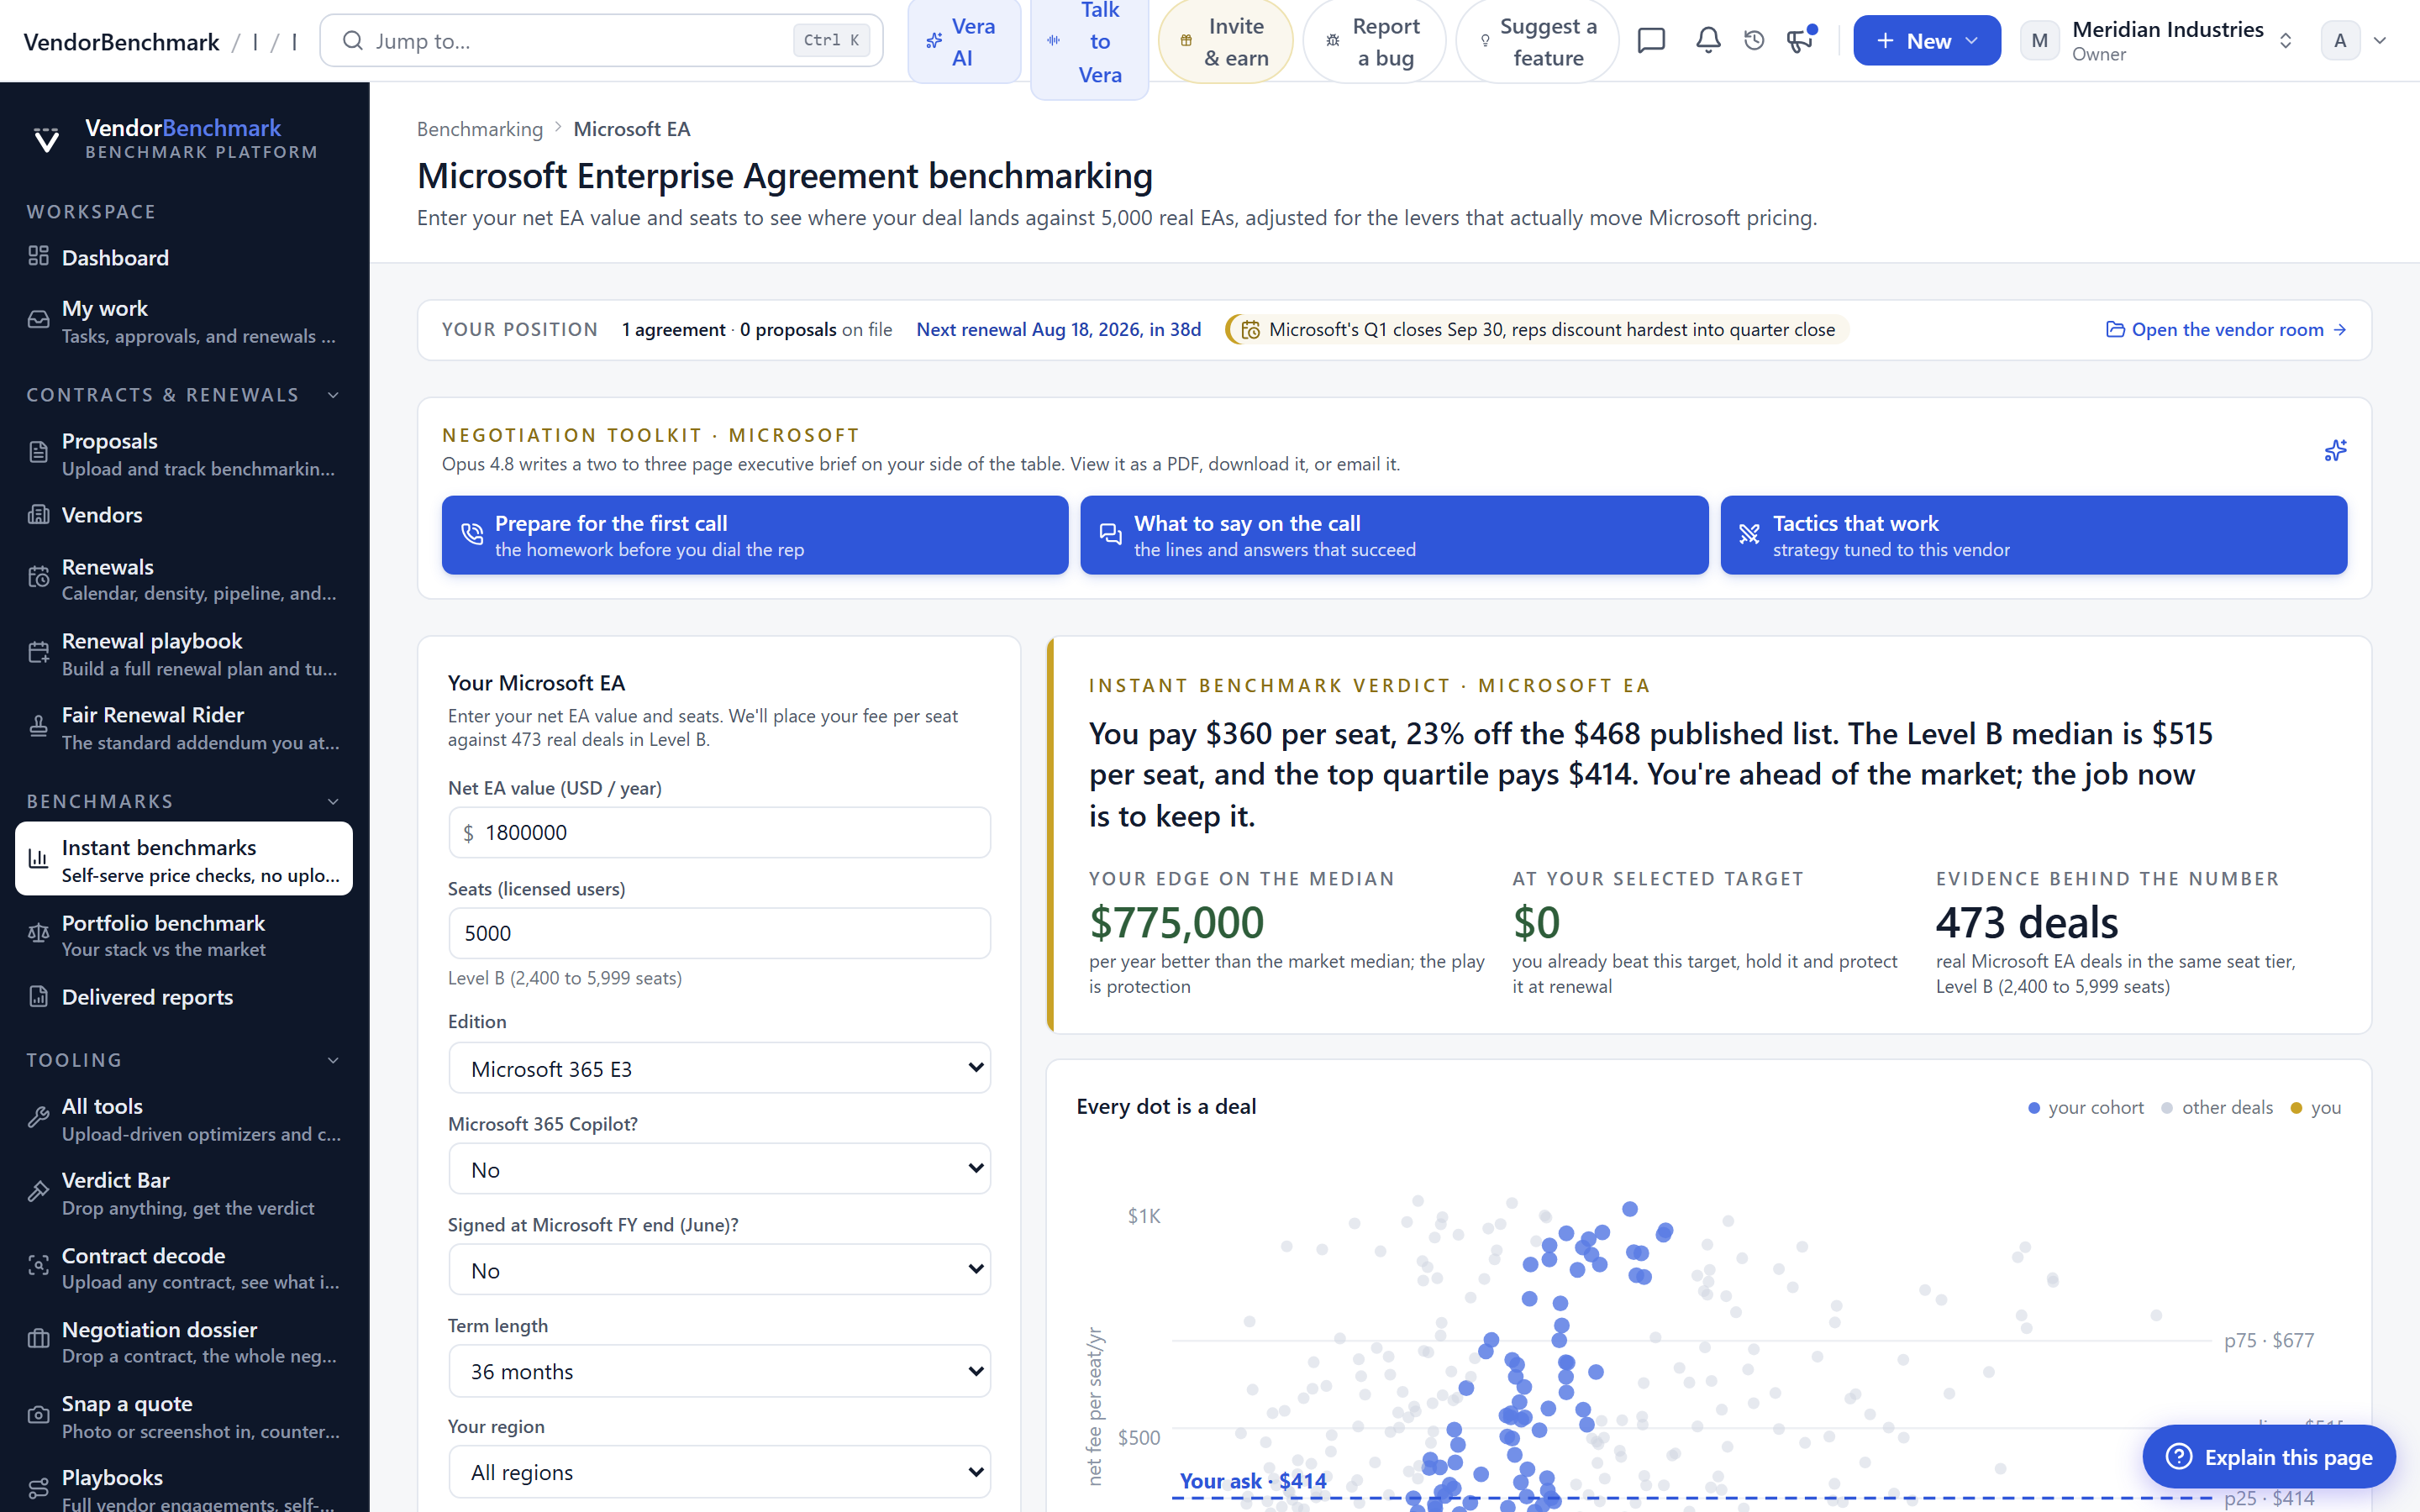
Run a benchmark and the headline that comes back is a percentile: you are at P42. Before anything else, be precise about what that sentence claims. Every metric in the library is oriented so that a higher percentile is a stronger buyer position, whether the underlying number is a net price where lower is better or a discount where higher is. P42 therefore reads one way only: within the cohort of deals comparable to yours, 42 percent of buyers ended up with a weaker outcome than you, and 58 percent did better.
Notice what the number is not. It is not a grade, not a prediction, and not an average. The market does not have one price it has a distribution, usually a wide one, and the percentile is simply your address in it. The reason we lead with it instead of an average is that averages lie twice in this data: they get dragged by outliers at both ends, and they invite the meaningless question "am I above or below average?" A distribution invites the question that pays: how much room is there between me and the buyers who did this well?
P42 against what, exactly: the cohort behind the number
A percentile is only as honest as the comparison set beneath it, so the cohort construction is where the real work happens. Four normalizations decide whether P42 means anything.
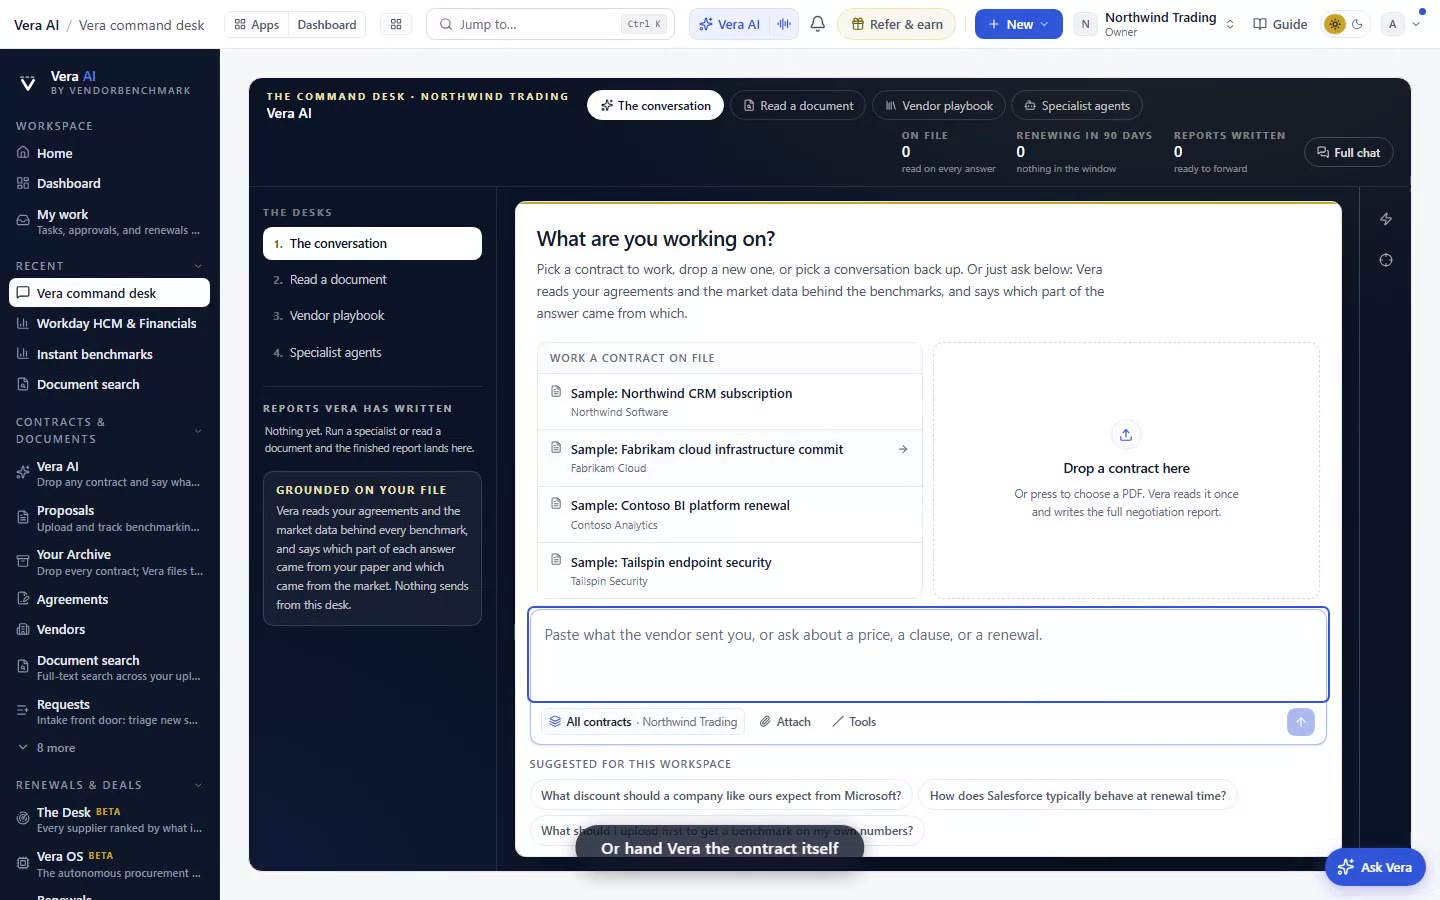
The metric is the vendor's real unit of money. Net value per seat for a Microsoft EA, net fee per user by edition for Salesforce, net ACV per FUE for SAP RISE, committed spend discount for the hyperscalers. Comparing discounts off list across vendors is theater; comparing what a unit actually costs is analysis.
Size, because scale buys price. A 400 seat deal placed among 40,000 seat deals would read as a catastrophe and mean nothing. Cohorts bracket deal size so you are measured against buyers with your leverage, not against the Fortune 50.
Term and structure, because commitment is currency. Three year prepaid deals price differently from one year renewals, and a cohort that mixes them punishes whoever it does not flatter.
Recency, because the market moves. Cohorts are recency weighted, and for flagship vendors they draw on comparable rows from modelled deal cohorts, so the distribution describes the market you are negotiating in, not the one from two cycles ago.
Want to be updated when major licensing and pricing changes land? One analyst brief a week: the price rises, metric changes and audit campaigns that move software costs. Work email only.
Turning an address into an agenda
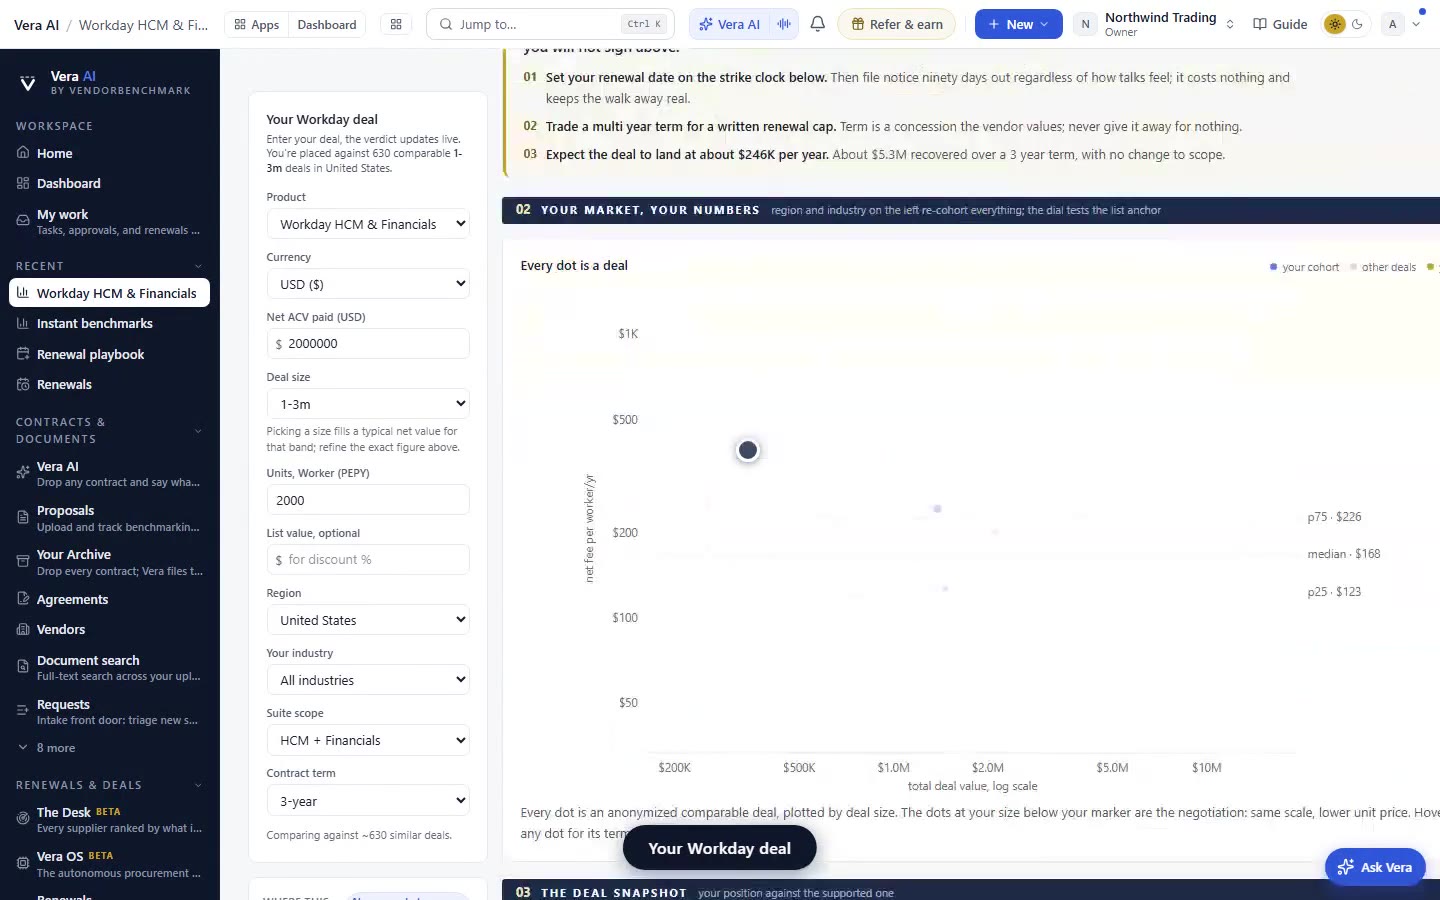
The percentile becomes useful the moment you convert it to dollars and dates. The result screen does the conversion: the gap between your price and the cohort median, and between you and the top quartile, each priced at your volumes per year. That is the negotiating range reality supports. Opening at "the best buyers pay X" with the top quartile number, and settling anywhere above the median gap, is a negotiation grounded in what deals shaped like yours actually close at, which is why it holds when the vendor asks where you got it.
Two readings save people from over- and under-reacting. A middling percentile on a small, strategic, or deliberately premium deal can be entirely rational: you may have traded price for terms, flexibility, or speed, and if the concession ledger shows what the gap bought, P42 is a receipt, not a wound. Conversely, a strong percentile is not permission to stop reading: a P78 on price can coexist with an uncapped uplift that will donate the whole advantage back within two renewals. The percentile prices today. The contract terms price the future.
And a saved position keeps working after you close the tab. Benchmark alerts re-run saved scenarios as the market moves, so if the cohort shifts against a deal you saved in March, you hear about it while there is still a renewal to aim at, and the portfolio view rolls every vendor's percentile into the one page the CFO reads.
Four questions to ask any percentile, ours included
The honest limit is thinness, and it is worth naming because it is where less careful benchmarks quietly cheat. Narrow cohorts are more comparable and smaller; broad cohorts are bigger and mushier. When your deal's natural cohort is too thin to be reliable, the result says so, and shows the nearest defensible comparison instead of manufacturing precision. A percentile you can interrogate is a negotiating asset. One you cannot is a number wearing a costume, and the vendor's deal desk will know the difference even if you do not.
Fredrik has spent more than twenty years in enterprise software, with time at Oracle, IBM, SAP, and Salesforce before moving to the buy side. He structured and priced the kind of large agreements most buyers only see once or twice in a career, which taught him where the leverage sits and how far a vendor will actually move. He started VendorBenchmark to hand that knowledge to every sourcing team.
The week in enterprise software buying, in one email.
What shipped on the platform, and the pricing and licensing moves worth knowing before your next renewal. One email a week, to your work address. Unsubscribe any time.