The curve library now prices the AI stack, Copilot through Mistral
Six curve documents join the discount program and cover the AI stack buyers are quoting today. Here is what changes at the table and where the numbers stop.
You have been asked to price an AI stack that did not exist at your last renewal cycle. The CFO wants a number for Microsoft 365 Copilot, someone in engineering already signed a Gemini pilot, a business unit is expensing Perplexity seats, and a data team is comparing Cohere deployment tiers against a self hosted Mistral. Each vendor prices on a different axis, each sales rep tells you the discount ladder is gone, and you have no market anchor to argue against. That is the problem this update addresses. Six more curve documents now join the discount curve program, and together they price the AI providers most enterprises are negotiating right now. If you are still framing the category, start with buying AI software: new metrics, new traps, same discipline.
What actually shipped
The new curves cover Microsoft 365 Copilot, Google Gemini with Vertex AI as one Google AI estate, xAI Grok, Perplexity, Cohere, and Mistral. Every dataset is calibrated to its August 2026 document, which matters because these price lists move faster than any traditional software category. A curve is not a single discount figure. It is the shape of achievable outcomes across spend levels, commitment lengths, and the specific dimension the vendor uses to meter you. That shape is what lets you read where a quote sits and what the next move is worth.
Copilot: the audit beats the discount
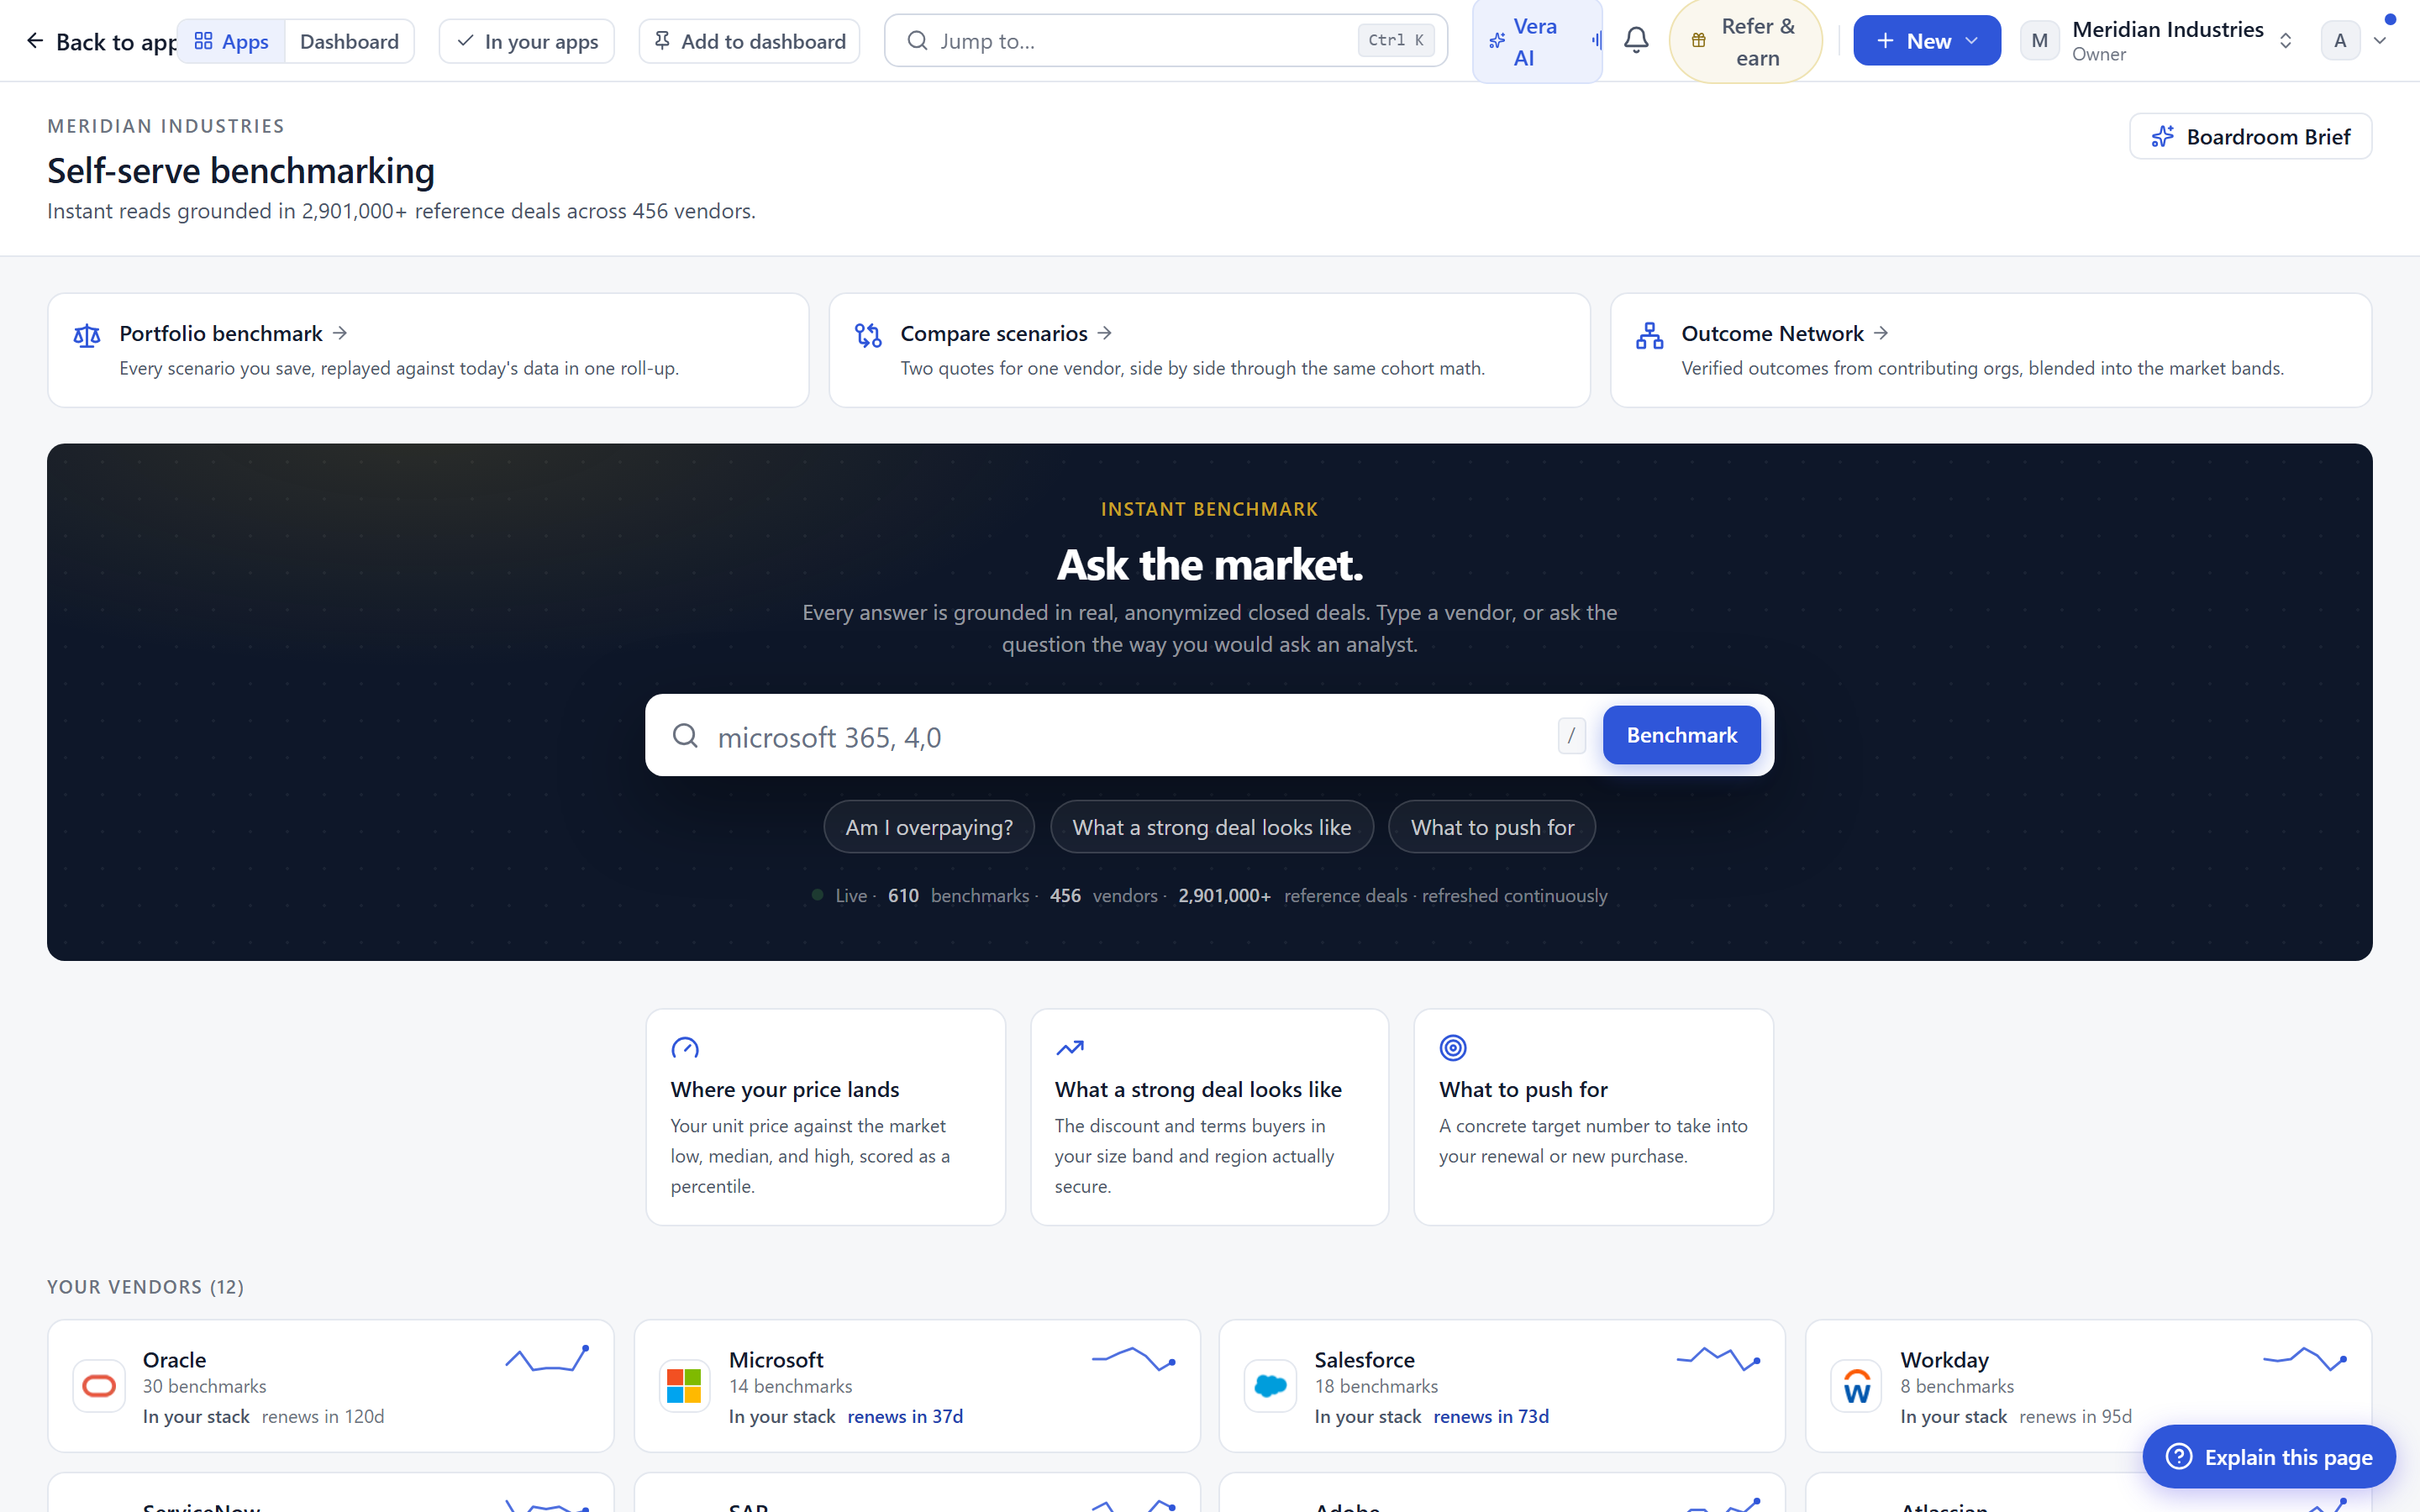
Microsoft 365 Copilot ships as a single thirty dollar SKU, which abolished the familiar level ladder, and Microsoft is telling everyone discounts are scarce. The documented reality is more useful. Landed pricing sits in an eighteen to twenty two dollar band, pilots of two hundred fifty to five hundred seats close at eighteen to twenty five percent off, and real usage runs at eight to fifteen percent of licensed seats. That last figure is the point. When most of your paid seats never open the tool, the utilization audit is worth more than any discount you could realistically win. You do not negotiate the rate down, you buy fewer seats and true them to usage. The mechanics of that argument, and how Copilot rides on your existing agreement, sit in our Copilot benchmark and connect directly to the E5 question.
Google, xAI, and the shape of each curve
Google Gemini and Vertex AI land as one Google AI estate, and it carries the deepest curve in the provider set, because Google buys share. The documented bundle stack reaches twenty five to forty percent below list at one to five million dollars of annual spend. The counter is not to accept the bundle as offered. Price each dimension standing alone, then assemble the bundle on your terms, so you own the arithmetic rather than inheriting theirs. xAI Grok is the youngest and most volatile paper in the library, so the discipline is to keep commitments short and treat the training data gate as the enterprise floor. You are not pricing a stable product, you are pricing an option, and short terms are how you hold that option cheaply.
Perplexity, Cohere, and the Mistral fallback
Three of the new curves reward reading the structure before the rate. Perplexity carries an eight times gap between its advertised enterprise tiers, and that gap is not an accident. It advertises the custom mid tier the vendor fully intends to negotiate, so your job is to name that middle rather than pick a published edge. Cohere's deployment tier decision moves your cost by ten times for identical tokens, which means the tier you land on matters more than any rate conversation you have afterward. Settle the deployment model first. Mistral is the only vendor in the set whose own open weights cap its managed pricing. Compute the self host total cost of ownership, and both sides know the fallback exists, which quietly bounds what they can charge for the managed service. That is a rare structural advantage, so use it explicitly. All of this feeds the wider picture in from spend list to savings plan.
What changes for the buyer
Where these curves stop
Be clear about what a curve is and is not. It is a documented distribution of achievable outcomes calibrated to a fixed point in time. It is not a promise that you will land at the deep end of the band, and it is not a substitute for your own usage data. AI pricing in particular moves faster than any category we track, which is why each dataset is stamped to its August 2026 document and why we recommend rechecking before a live negotiation rather than trusting a figure you saved last quarter. The curves also assume you bring leverage the vendor recognizes, spend commitment, multi year term, or a credible fallback such as Mistral self host. Without one of those, the deep end of the curve stays theoretical. Finally, these are provider level curves. Your specific tenant, existing Microsoft agreement, or regulated deployment can shift the number in either direction, and only your own estate data closes that gap. Read the curve as the floor of your preparation, not the ceiling of your outcome.
Want to be updated when major licensing and pricing changes land? One analyst brief a week: the price rises, metric changes and audit campaigns that move software costs. Work email only.
Morten brings two decades of enterprise and software procurement, with stints across Oracle, IBM, SAP, and Salesforce shaping how he reads a deal. He has led sourcing through hundreds of renewals, from mid market order forms to nine figure global agreements, and learned that the buyers who win are the ones who walk in knowing the market. He built VendorBenchmark to make that pattern recognition repeatable.


