A benchmark is only as good as what sits underneath it. A buyer about to quote a range to a vendor, or to a CFO, should be able to ask where that range came from and get a straight answer.
The Benchmark Library is the data layer under every benchmark in Vera AI by VendorBenchmark, from the instant check to the analyst's report. Here is how it is built, how each line is graded, how it stays current, and what you see when you search it.
Built by product line, on the meter the vendor bills
The library is organized by vendor and product line, because big publishers do not price as one vendor. Salesforce is broken out into Sales, Service, Commerce, Experience, Revenue, Field Service, Platform, Agentforce, CRM Analytics and its industry clouds. SAP covers S/4HANA on premises and in RISE, with RISE Base and RISE Premium on separate curves. You pick the exact product line you are negotiating, not the vendor in general.
Each line is banded on the unit that decides the bill. Most band on contract value. Adobe Creative Cloud and Zoom band on seats, CrowdStrike and SentinelOne on protected endpoints, Epic on hospital beds, MuleSoft on production vCores, and AWS, Databricks and Snowflake on annual committed spend. Where the band is a count rather than money, two buyers spending the same amount can sit in different bands, which is the point.
Some lines measure a rate, where lower is better: athenahealth on the percent of collections, Citrix and TIBCO on the renewal increase. On those the sheet inverts, so the worst rate ranks Poor, and the page says which kind of line you are reading.
Graded on its evidence, and open about it
Every curve is built and graded by buyer side analysts, never by vendors. Each commercial line carries the median outcome with its range and the grade of the evidence behind it, and it states its baseline on its face: a published list, a published rate card, or the vendor's opening quote. A line measured against an opening quote says so, rather than implying a list that does not exist.
Where a curve rests on thinner evidence, as many indirect supplier lines do because those suppliers publish no price lists, the band is deliberately wider and the line says so, with the date it is next due for review.
Behind the curves, our analysts keep a price book of curated anchor prices and add verified datapoints. Contributed data joins only anonymously, behind a floor of five, so no deal can be traced back. A peer row is shown by generic sub sector, no counterparty is ever named, and neither are you.
A range you cannot trace is an opinion. Every line here says what it rests on.
Kept current, and dated
The library is refreshed monthly, and every page says when it was last priced. Terms Watch diffs vendor price lists on every refresh and prices the change at your seat count, so a list price move shows up the day it lands. The Software Price Index publishes a quarterly, citable view of software pricing as versioned snapshots you can quote in a board paper.
Pricing changes are modeled where they happen. Microsoft removed the Enterprise Agreement volume discount levels for online services on 1 November 2025, so the Microsoft EA tool carries a pricing era control. Agreements under the new rules benchmark roughly 10 points less discount than the legacy price sheet, unless they commit Copilot on an E5 or E7 estate, and renewals still on a legacy price sheet keep it until they renew.
Your own positions stay current too. Save a position and you get an alert when the market moves against it.
What you see when you search it
The library opens on Deal: the vendor, the annual value, the discount offered and the term in one row, then the product line, the peer group, the payment and the signing month. The peer group can be all peers, the same industry, the same country or both, and the range moves with it.
Every vendor opens the same sheet: the three answers, the curve with your deal on it, and the bottom line. The sheet says whether an analyst has written the vendor's curve up as a document or the range is measured on the vendor's own reference deals. The Standard view adds what the comparison rests on: the years the figures span, the date of the last read, a confidence word with its reason, and what moves if one input is wrong.
Comparable customers, where the library holds them, are real order forms read by hand and masked: an industry, a region on another continent and a size cue, never a name, an order number or a person.
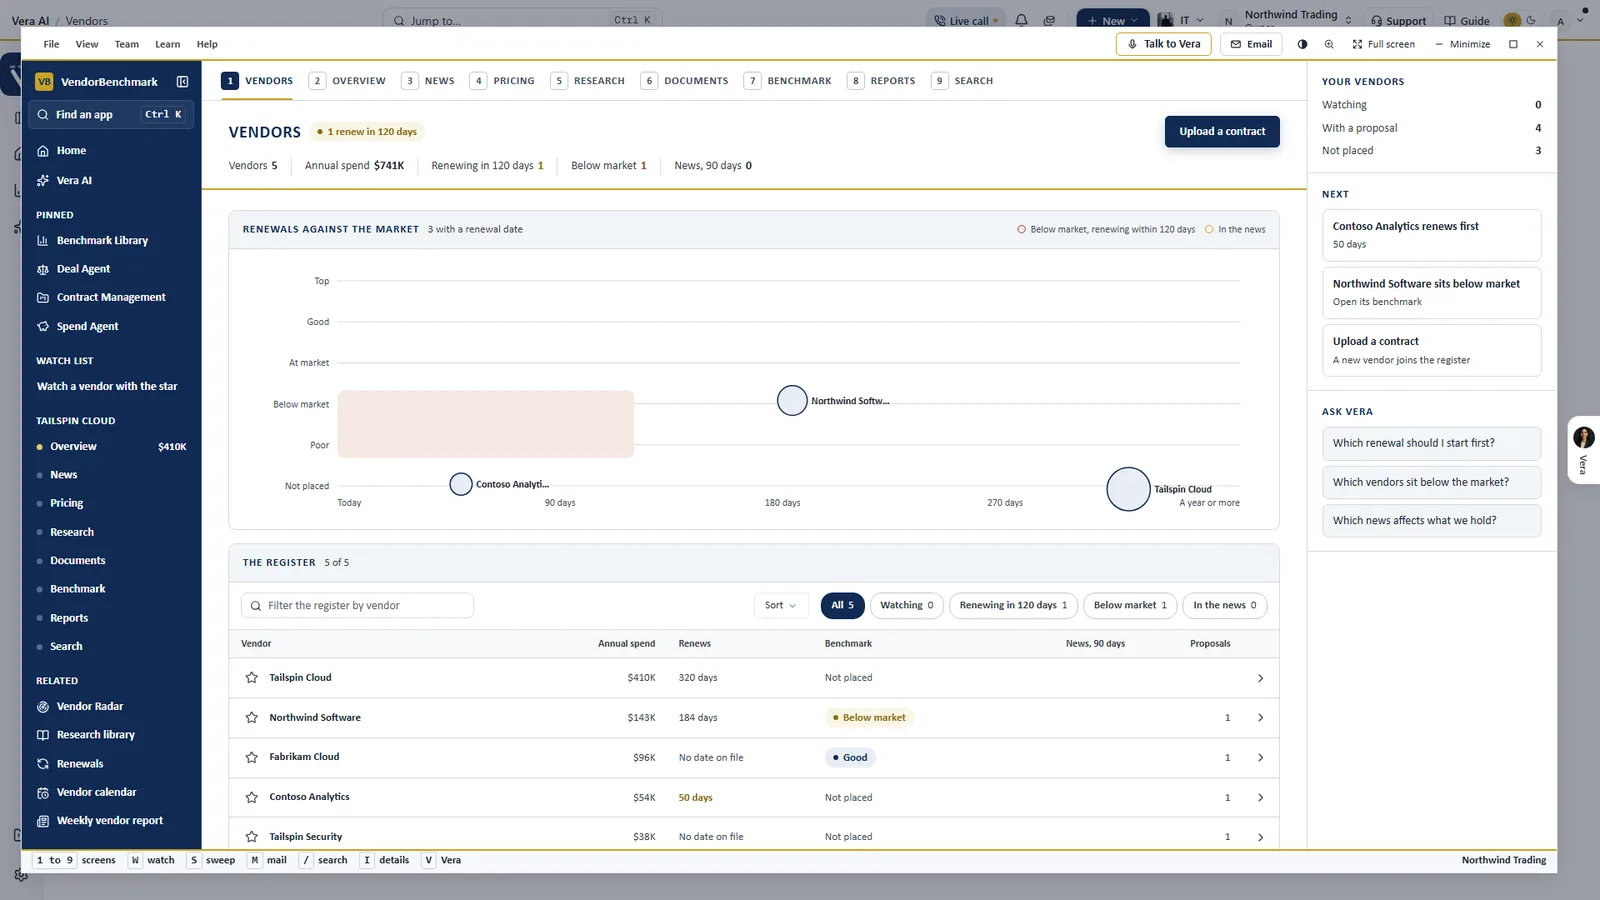
Your own book against the market. The Vendors register on a sample workspace places each vendor you hold on the five ranks against the days to its renewal. A vendor with no benchmark behind it yet reads Not placed, not a guess.
Where it sits
The library is the ground the rest of the cluster stands on.
- The three answers it produces for every line.
- How it handles an order form with no list price: rate against rate, never a derived list.
- The three speeds that all read from it.
The AI benchmarking guide maps the cluster, the Benchmark Library app page shows how to open it, and our methodology sets out the method in full. An earlier post walks through how the library was put together, one method across every vendor.
What to do first
- Find your vendor. Open the Benchmark Library and pick the exact product line on your paper.
- Read the basis. Check whether the line rests on a list, a rate card or an opening quote, and when it was last priced.
- Set your peer group. Narrow to your industry or your country and watch how far the range moves.
- Save the position. Save it so it joins your estate, and get an alert when the market moves against it.
Questions buyers ask
How many vendors does the library cover?
1,471 vendors, down to the SKU and edition, from enterprise applications, cloud and data, and security to collaboration, customer and revenue tools, and finance, HR and legal.
Who grades the data?
Buyer side analysts build and grade every curve. Vendors never do.
How current is it?
The library is refreshed monthly, and every page says when it was last priced. Vendor price lists are diffed on every refresh.
Can a contributed figure be traced back to a company?
No. Contributed data is anonymized behind a floor of five, peer rows are shown by generic sub sector, and no counterparty is ever named.
What happens when the data is thin?
The line says so. Where too few comparable customers match a position to rank it honestly, the page says so rather than show a noisy figure.