The board pack is one of the costliest documents procurement writes. The figures come from several systems, the deck is dated by the time it is presented, and the first question from the CFO is where a number came from.
Report Studio is the reporting agent in Vera AI by VendorBenchmark. It writes reports for the board, the CFO, the CIO or procurement from the agreements you have stored and nothing else, then checks every figure against your data before the report is filed. Here is how a report is asked for, written, read and sent.
Say who it is for and what it is about
A report starts on New report. Type what you need in a line, for example renewals next quarter for procurement, and the box sets the reader, the length and the vendor from it. Or choose them yourself: the reader is the board, the CIO, the CFO or procurement; the length is Brief, Standard, Full or Deep; the scope is the whole estate or one vendor; the output is a dashboard or slides, and every report exports both files.
Suggested offers three reports picked from the estate as it stands, each with its reader, two figures, a small chart and Run. Needs you lists what wants a decision: a renewal with no brief, a report not opened, a schedule due.
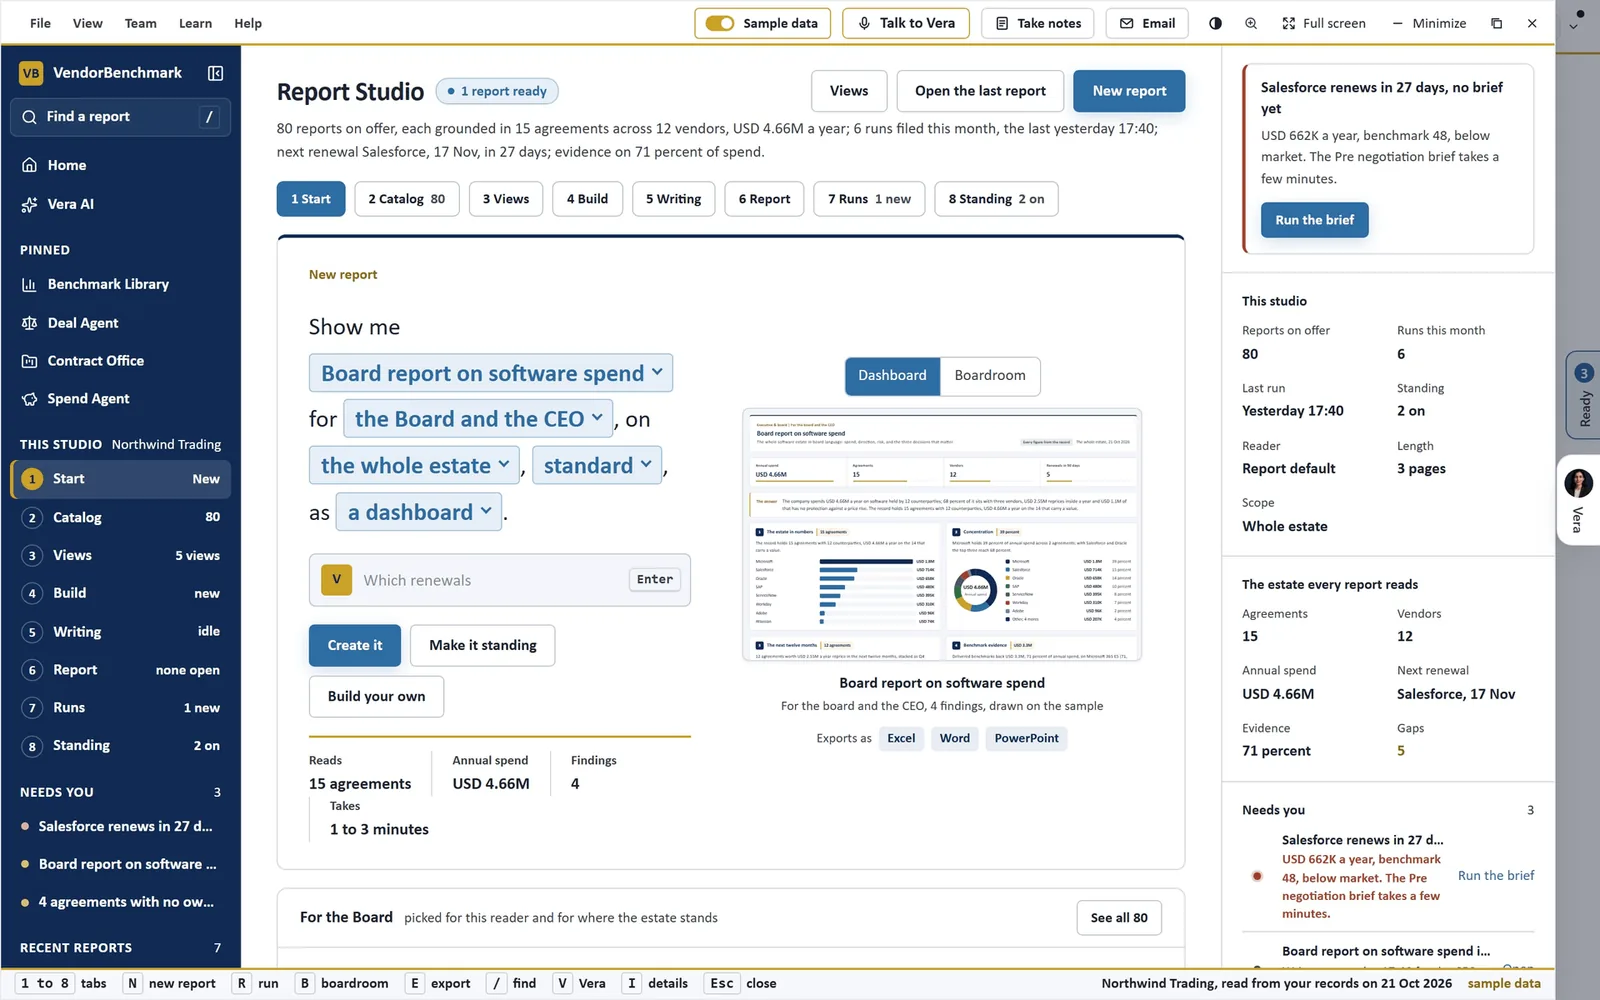
One sentence, one report. Report Studio's start screen on the sample: a board report on software spend, for the board and the CEO, on the whole estate at standard length, as a dashboard, with the preview beside it and the exports as Excel, Word and PowerPoint.
Every figure is checked before the report is filed
A report is written from your stored agreements only. While it is written the dashboard fills in front of you: a bar shows the five steps, reading agreements, setting the figures, writing, checking figures and filing, and a dot appears for every figure as it is checked. On your own record a run takes 1 to 3 minutes and keeps writing if you move to another screen.
Where the data cannot support a number, the report says not on file instead of estimating. Every figure, chart mark and row says on hover what it is and where it came from, and Record lists the agreements behind the report.
The same report reads differently for each reader. The board version leads with what the board must decide. The CFO version leads every finding with the number. The CIO version reads the estate as platform strategy, and the procurement version is an ordered work list.
Where the data cannot support a number, the report says not on file.
Read as a dashboard, shown as slides, sent as files
A report opens as its Dashboard: one summary line, the head figures with what changed, a tile for every finding with the chart that fits it, Decision with the bottom line and three figures, Moves in order with Draft email on each, and Record. Edit layout lets you drag tiles into another order, make one full or half width, or hide it.
Slides shows the same report as 16 by 9 slides with the speaker notes under each, and Present shows them full screen. Data lists the agreements behind the report as a table. Where a report prices an uplift, its slider reprices what an uncapped renewal would cost.
Export downloads the files. The Excel workbook has six sheets, Summary, Agreements, Renewals, Vendors, Findings and Checks, with live formulas and one Uplift input on Summary that moves every exposure figure. The PowerPoint deck has a slide for each finding, native charts you can restyle and the full finding in the speaker notes. Export to Word writes the report in the firm's document design, and Forward sends a colleague a read only link for 30 days.
Eighty reports, and a builder for the rest
Templates holds all 80 reports in eight families, filtered by family and reader, and each says whether its last run is current, has agreements added since, or was never run. Examples holds 31 finished reports on six sample estates: a manufacturer, a bank, a health system, a university, a retailer and a software company.
When the catalog does not have it, Builder makes it. Six recipes start you off, Board brief, Renewal pack, Vendor deep dive, Risk register, Budget pack and Diligence pack; you pick the findings, drag them into order and run the report. Charts cuts any figure by any dimension, from vendor to renewal quarter, and Add to a report puts the chart in the builder.
The Spend Agent holds its own reports to the same rule. Write your own report reads a request in your own words against your vendors and categories, and Write it up checks every figure in its prose against the figures computed for it. A sentence with any other number is left out.
Reports that arrive without a request
Schedules runs a report by itself. Pick the report, the cadence, the reader and who receives it; it runs overnight on its day, and Run now writes it today. The reader receives a read only link to the filed report, open for 30 days. Every run files with its versions, so a scheduled run never overwrites last month's edition.
Two more arrive on their own. The Research Agent files a weekly update for the vendors you hold, and its Commission a document buttons turn that coverage into a renewal strategy brief or a Monday briefing. The Monthly briefing records your portfolio as a five minute spoken brief on the 2nd of each month.
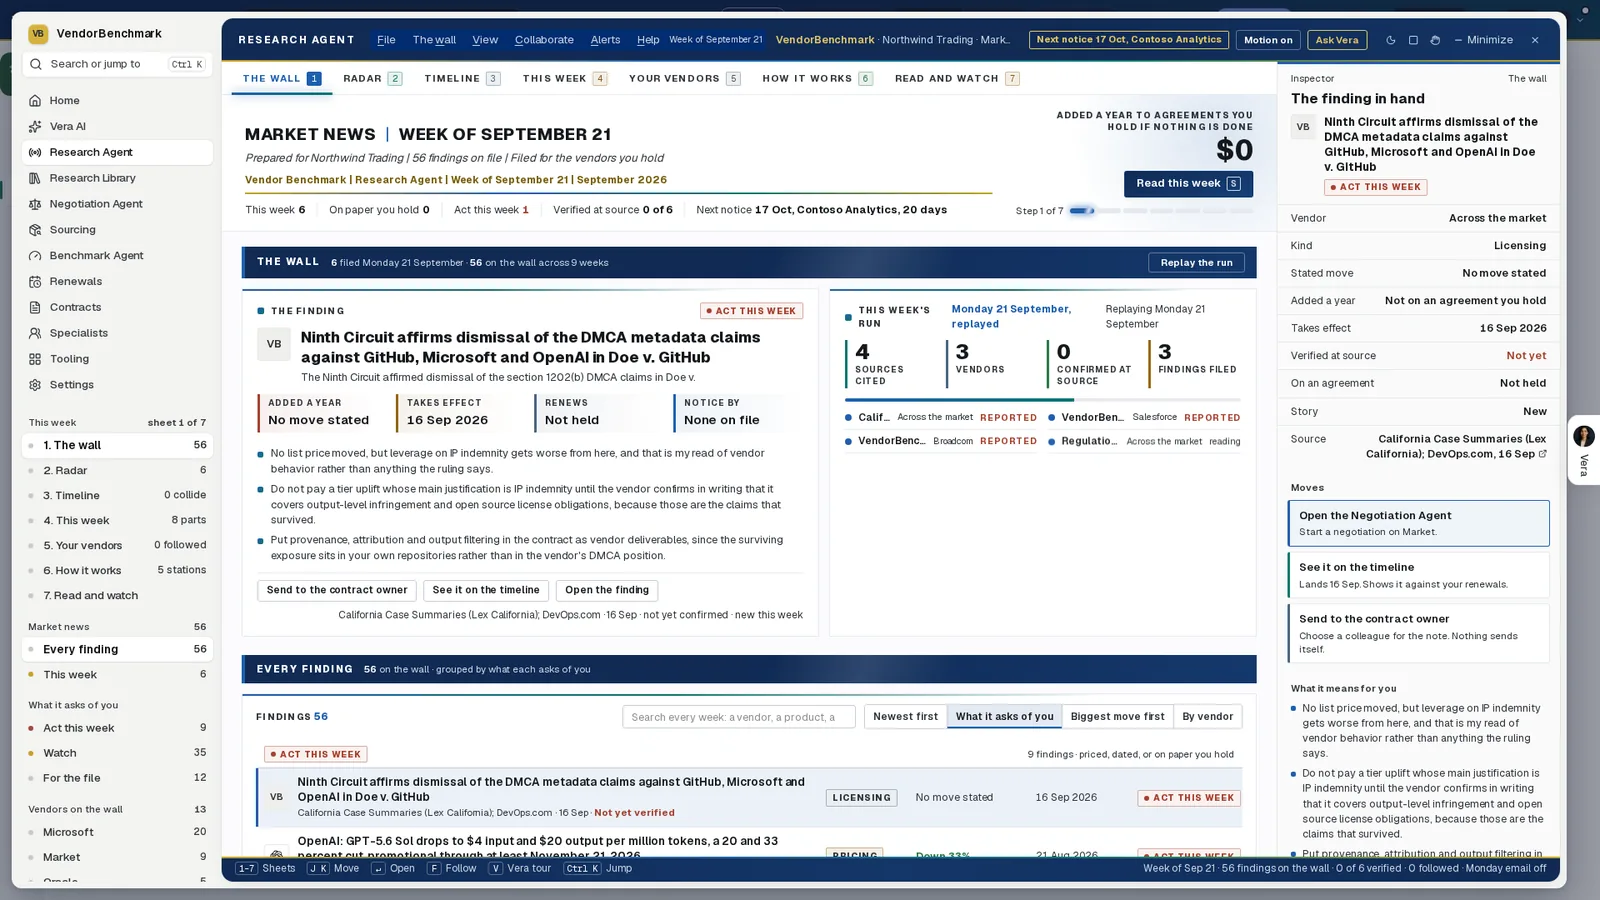
The week, filed for you. The Research Agent's weekly market news on the sample, filed for the vendors you hold: the finding in hand with its dates, this week's run with the sources it cited, and the moves beside it.
Where it sits among the spend agents
Report Studio is where the cluster's work becomes a document. The full guide to AI spend analysis shows the rest.
- The ranked savings are what a board pack argues from: each saving scored, evidenced and approved.
- Invoices against what you signed supplies the proof: recoveries counted once, savings confirmed by later invoices.
- The app is on the Report Studio page.
For why a filed report holds up in front of a board better than a chat answer, see our earlier piece on reports against answers.
What to do first
- Open an example. Turn on Sample data and open one of the 31 finished reports on Examples.
- Ask for one. On New report, type the ask in a line, check the reader and the length, and press Create report.
- Test the numbers. Export the workbook and change the Uplift cell on Summary; every exposure figure follows.
- Schedule the quarterly. On Schedules, press New schedule and pick the report, the cadence, the reader and who receives it.
Questions buyers ask
Where do the figures in a report come from?
From your stored agreements only. Every figure is checked against your data before the report is filed, and on hover each one says where it came from.
What happens when a value is missing?
The report says not on file instead of estimating. The Data gaps report lists which missing values and dates to fix first.
How long does a report take?
On your own record a run takes 1 to 3 minutes, and it keeps writing if you move to another screen.
Can a report run on a schedule?
Yes. A schedule runs overnight on its day and sends the reader a read only link to the filed report, open for 30 days.
Which files can we export?
An Excel workbook with six sheets and live formulas, a PowerPoint deck with native charts you can restyle, and a Word document in the firm's design.